


S&P 500 – 3050 almost reached, mix elements now
click to enlarge charts
Key Levels (1 to 3 weeks)
Resistances: 3050, 3080 & 3120
Supports: 3010, 2940 & 2855
Directional Bias (1 to 3 weeks)
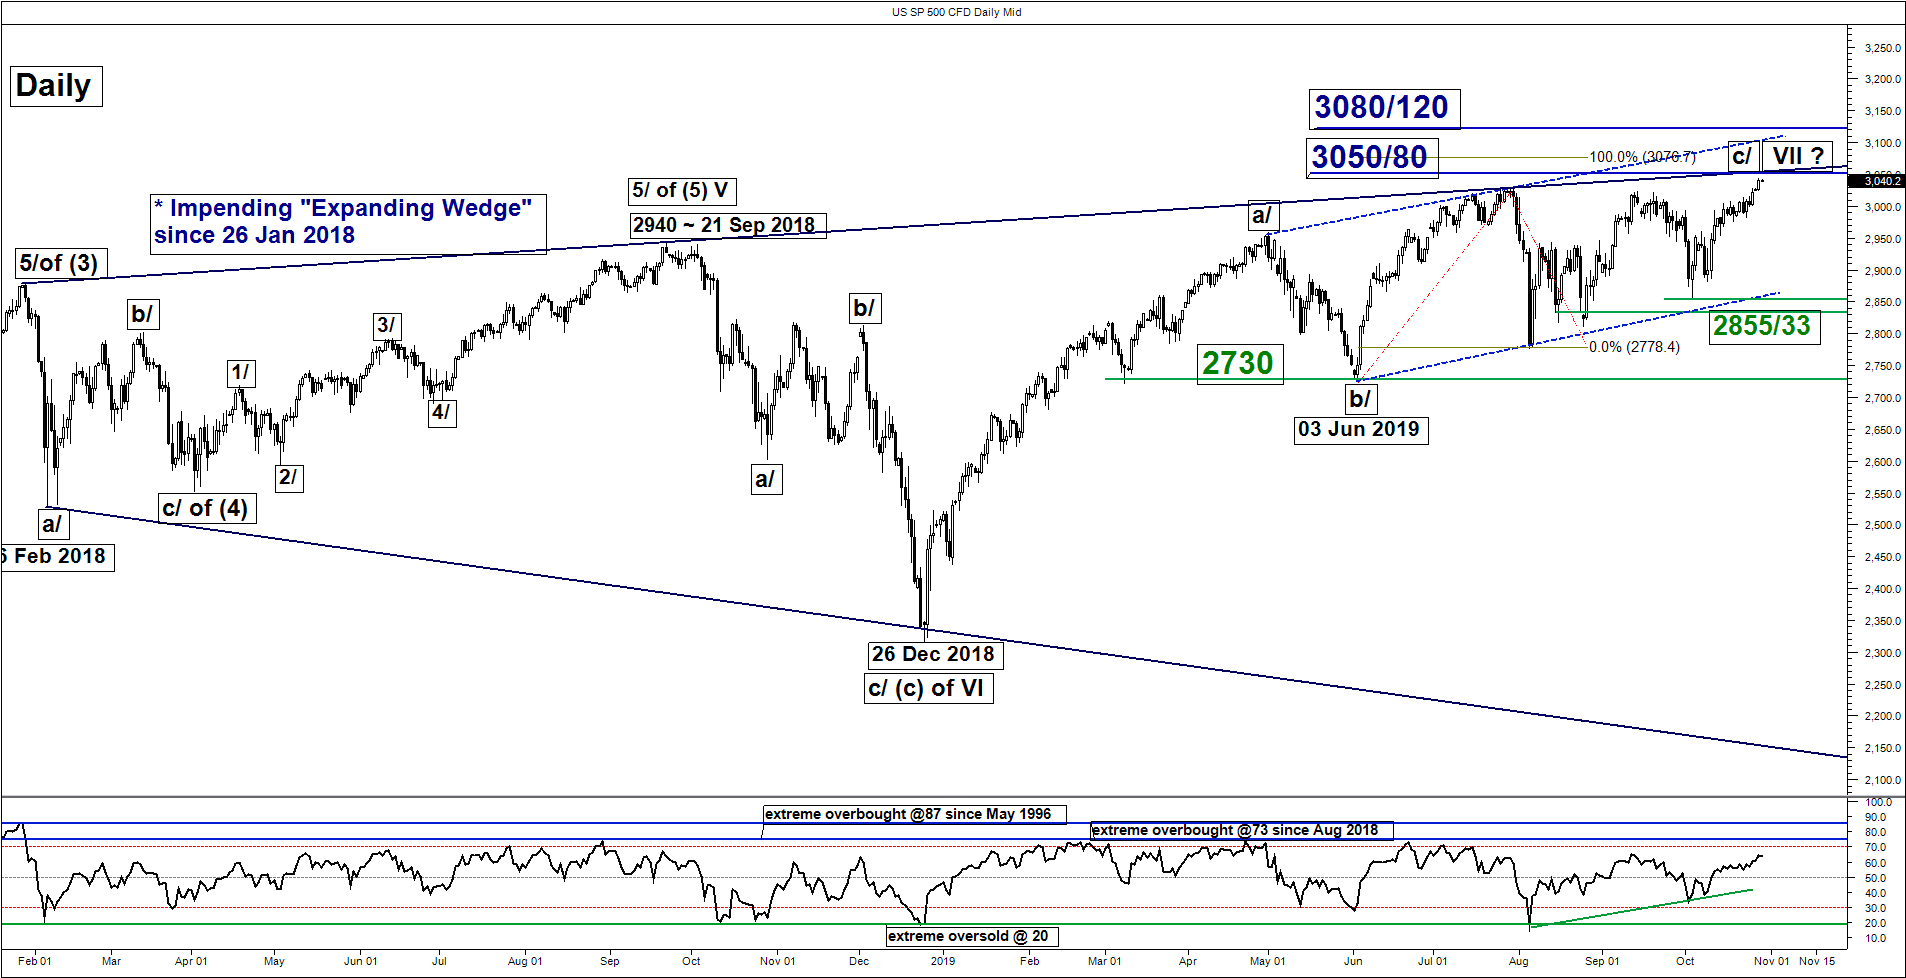
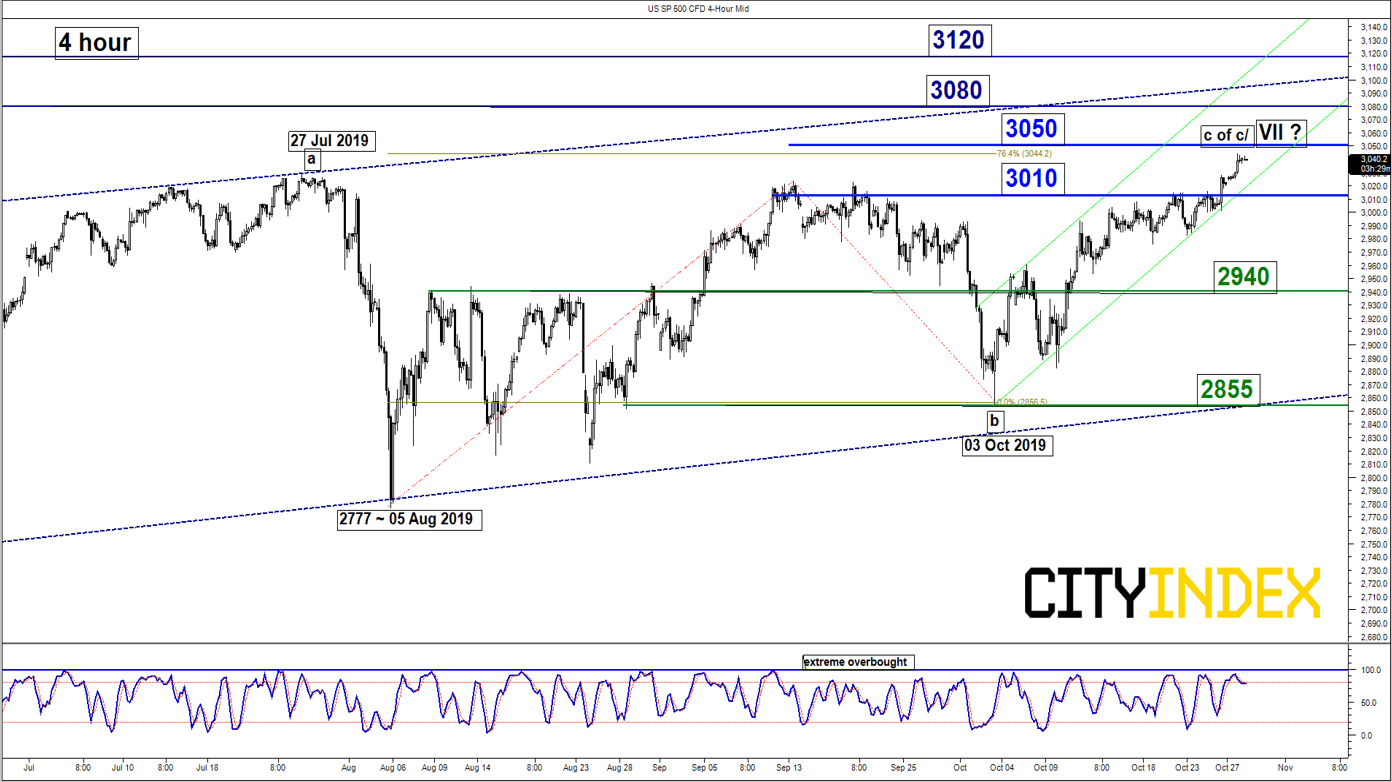
The SP 500 Index (proxy for the S&P 500 futures) has continued to drift higher as expected and broke above its previous all-time high of 3028. It printed an intraday high of 3044 in yesterday, 28 Oct U.S. session and closed at 3039.
The Index is now hovering right below the lower limit of the upside target/resistance of 3050 as per highlighted in our previous report (click here for a recap) with mix elements. Thus, prefer to turn neutral first between 3050 and 3010. A clearance above 3050 sees a further potential rally to target 3080 and 3120 next. On the flipside, failure to hold at 3010 opens up scope for a corrective decline towards 2940 and 2855 (03 Oct 2019 swing low area & lower boundary of ascending range from 03 Jun 2019 low).
Key elements
- The Index is now coming close to a major “Expanding Wedge” upper limit now acting as a resistance at 3050 that also confluences with a Fibonacci expansion cluster that increases the risk of a downside reversal. The previous all-time of 3028 printed on 26 Jul 2019 has tested the “Expanding Wedge” resistance before it staged a decline of -6.5%.
- Both the daily RSI and 4-hour Stochastic oscillators are coming close to extreme overbought levels which suggests the recent up move has been overstretched where the risk of a mean reversion decline increases.
- The Index is now evolving in a minor ascending channel in place since 03 Oct 2019 and still has room to manoeuvre to the upside before it reaches its upper boundary resistance at 3120.
- The next resistance zone of 3080/3120 is defined by a Fibonacci expansion cluster and the upper boundary of the medium-term ascending range configuration in place since 03 Jun 2019 low.
Nikkei 225 – Residual push up before risk of corrective decline
click to enlarge charts
Key Levels (1 to 3 weeks)
Pivot (key resistance): 23450
Supports: 22600 & 22130
Next resistance: 24400
Directional Bias (1 to 3 weeks)
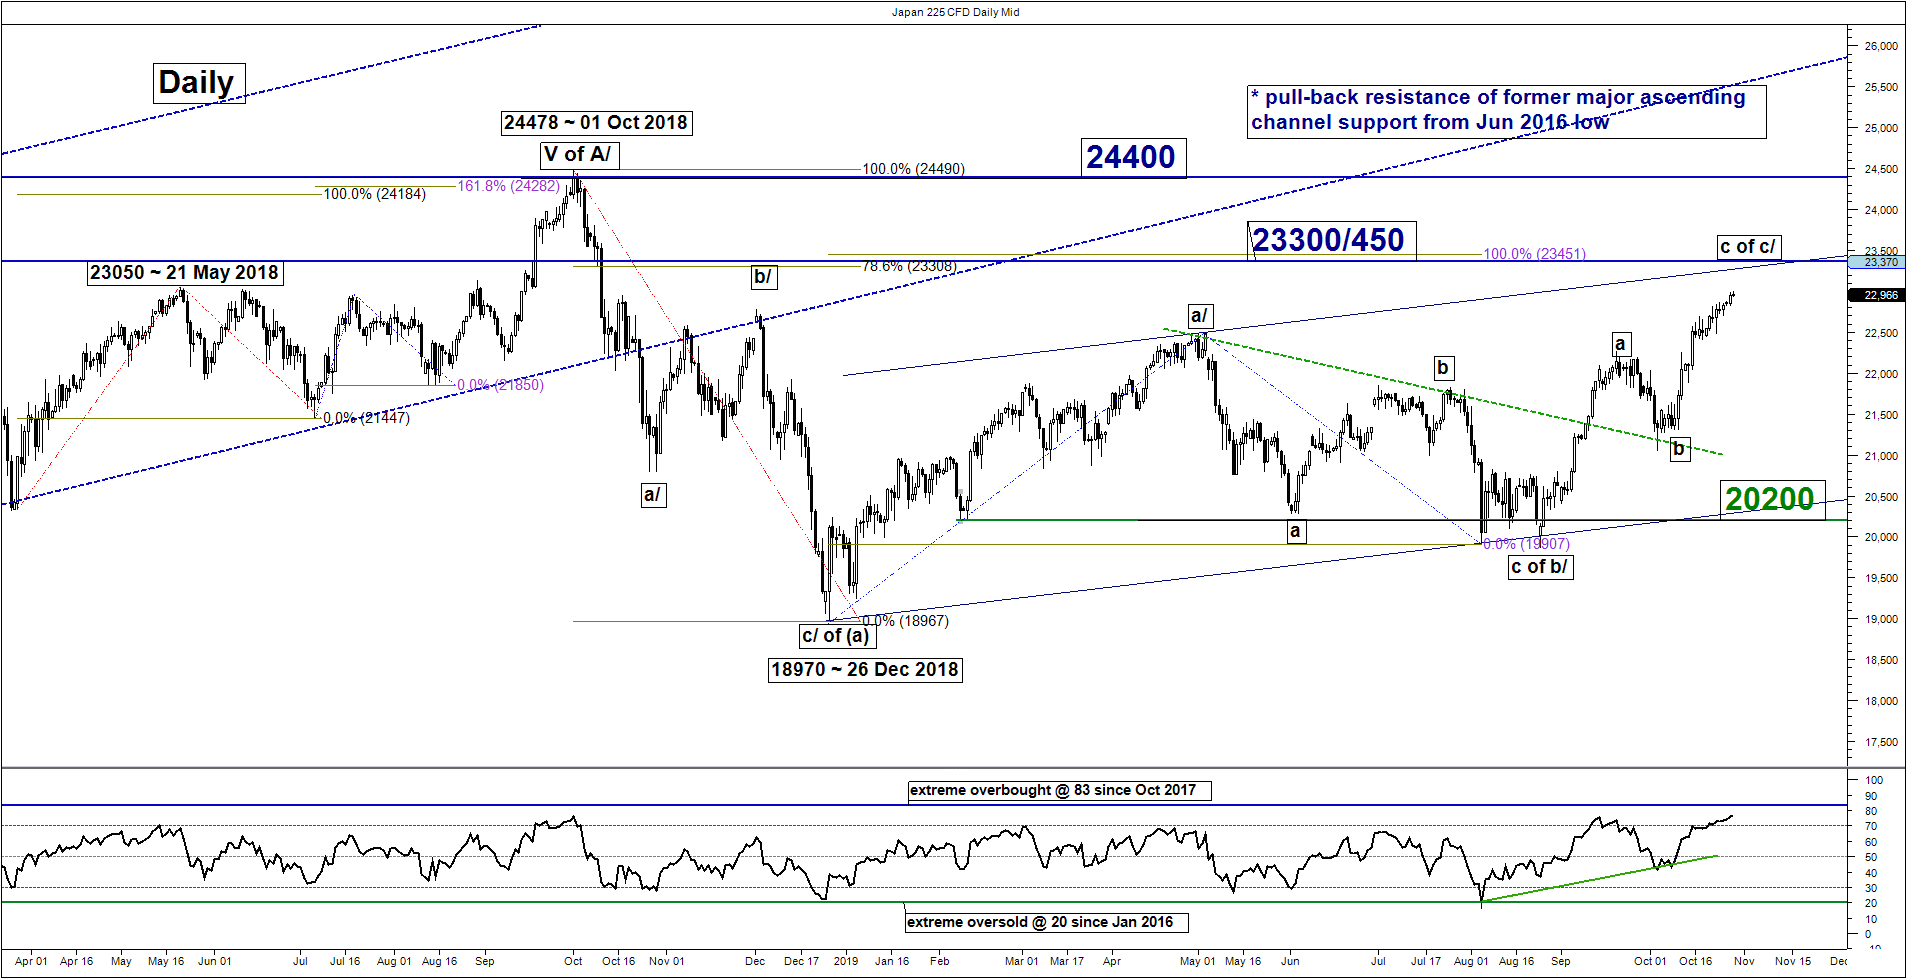
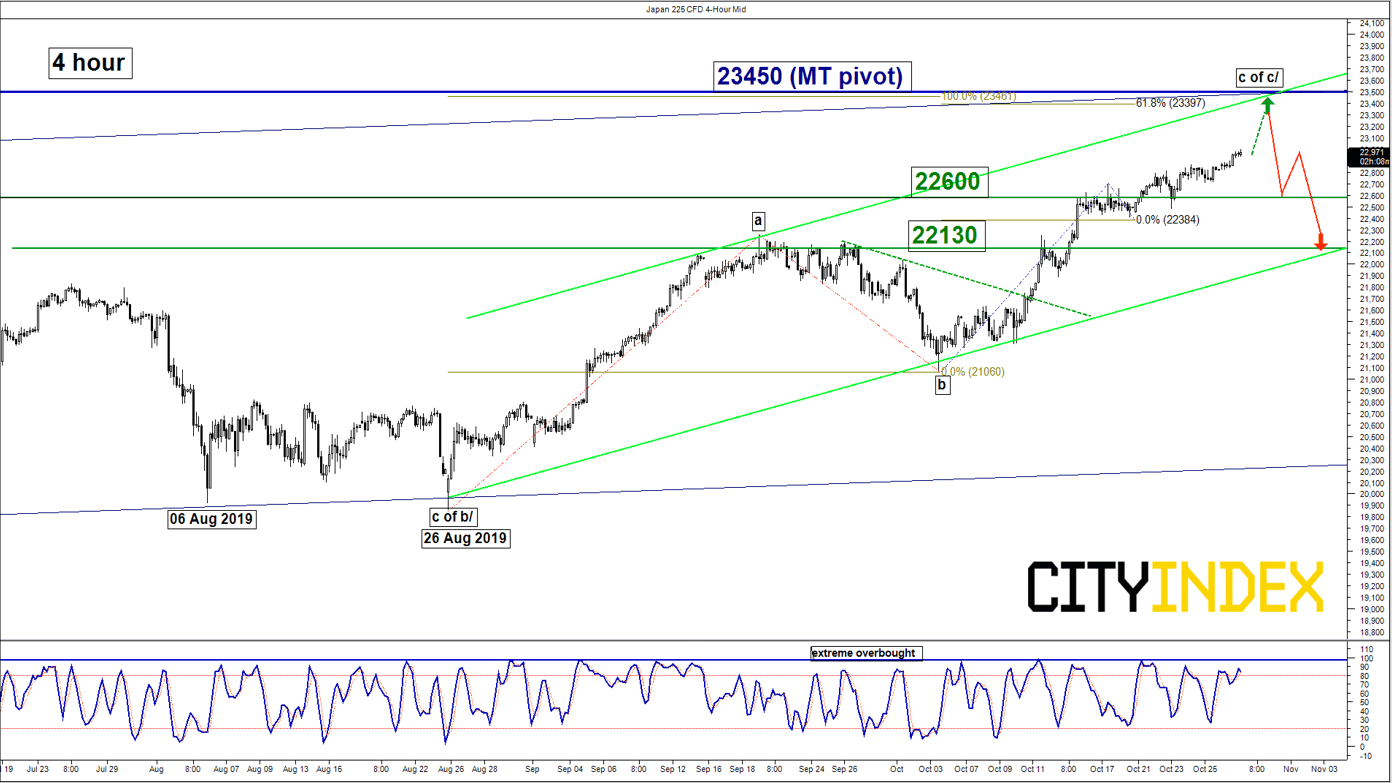
The Japan 225 Index (proxy for the Nikkei 225 futures) has staged the expected rally and met the upside target/resistance at 22490 and 23050 as per highlighted in our previous report.
Right now, flip to a bearish bias in any up move below 23450 key medium-term pivotal resistance for the start of a potential multi-week corrective decline to target 22600 follow by 22130 support next (also the lower boundary of the minor ascending channel from 26 Aug 2019 low).
On the other hand, a clearance with a daily close above 23450 invalidates the bearish scenario for an extension of the up move towards the next resistance at 24400 (01 Oct 2018 major swing high area,
Key elements
- The 15% rally from 25 Aug 2019 low of 19866 is now coming close to the upper boundary of the major ascending channel from 26 Dec 2018 low that intersects with the upper boundary of the medium ascending channel from 26 Aug 2019 low at 23300.
- The 23300 resistance also confluences with a Fibonacci expansion/retracement cluster that indicates a potential reversal zone at 23300/450.
- The daily RSI oscillator is now coming close to an extreme overbought level of 83 coupled with similar extreme overbought reading seen in the shorter-term 4-hour Stochastic oscillator. These observations suggest that the medium-term up move in place since 26 Aug 2016 low is overstretched where the risk of a mean reversion decline increases.
Hang Seng – Stalling right below medium-term descending trendline
click to enlarge charts
Key Levels (1 to 3 weeks)
Intermediate resistance: 27070
Pivot (key resistance): 27400
Supports: 26400 & 25500
Next resistances: 28000 & 29000
Directional Bias (1 to 3 weeks)
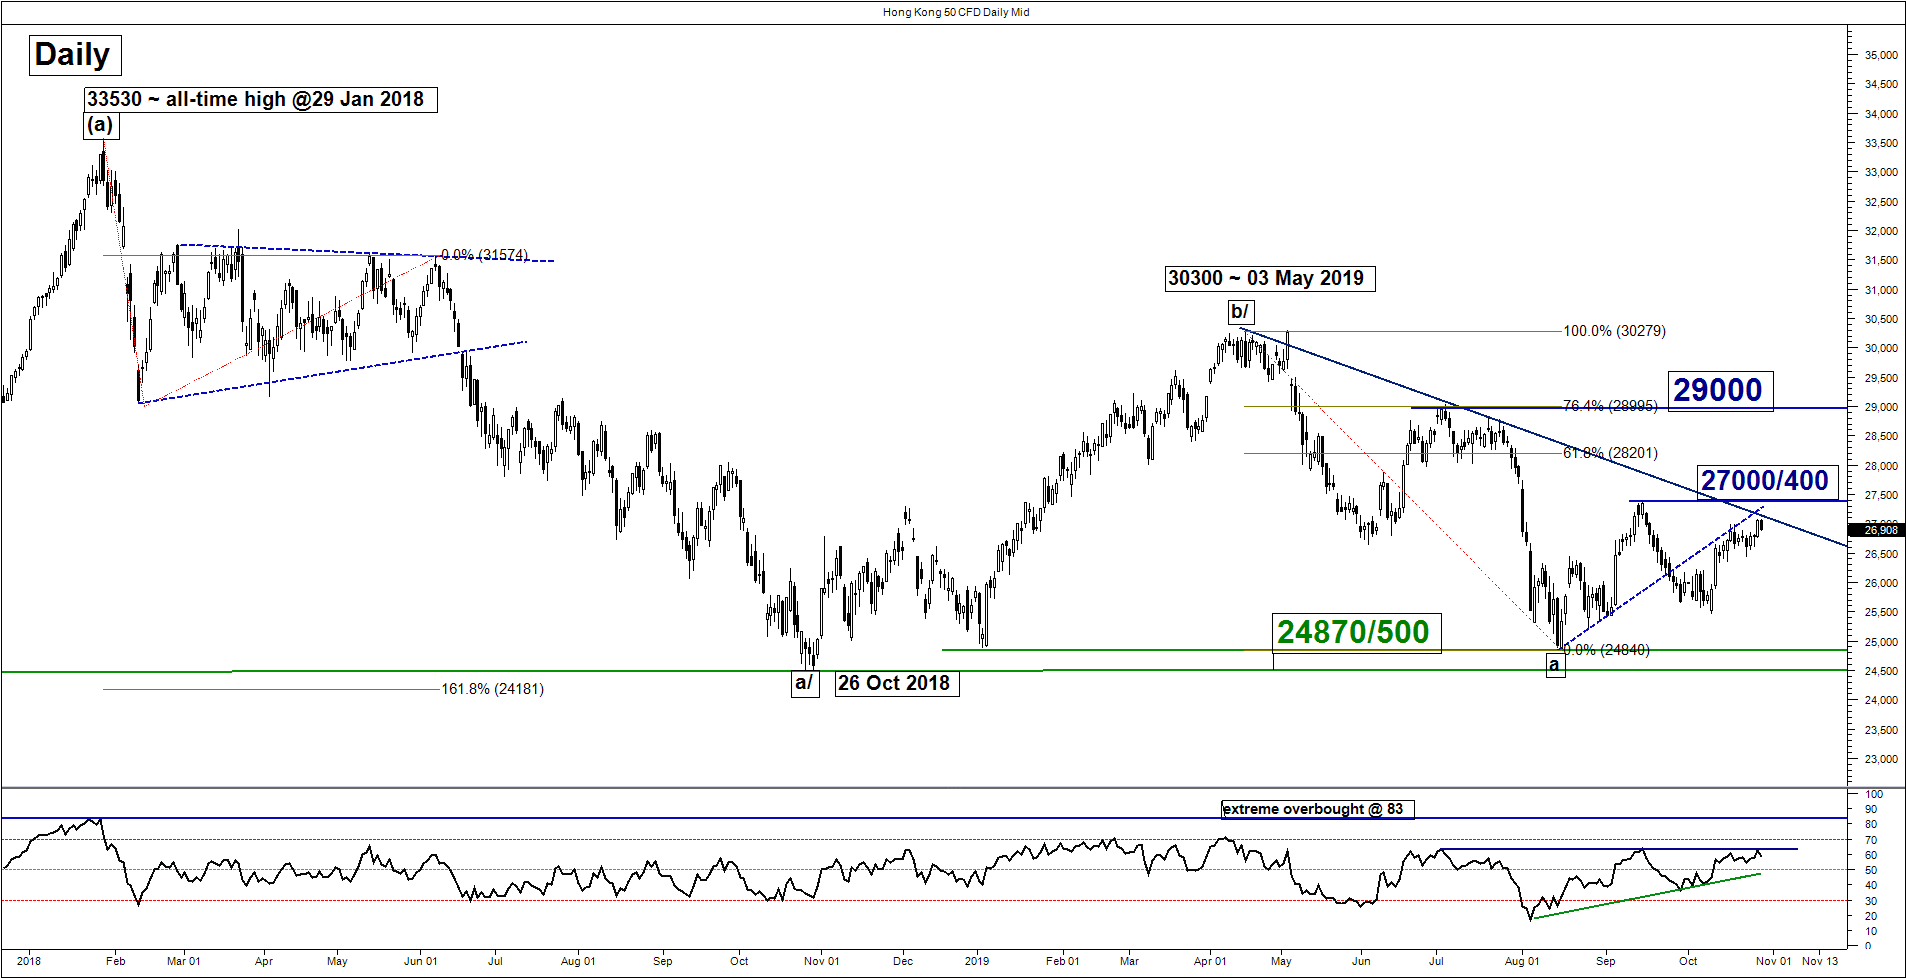
Bearish bias below 27400 key medium-term pivotal resistance on the Hong Kong 50 Index (proxy for Hang Seng Index futures) for a potential push down to target 26400 follow by 25500 support within a major “triangle” range configuration in place since 26 Oct 2018 low.
On the other hand, a clearance with a daily close above 27400 invalidates the bearish tone for a squeeze up towards 28000 and even the 02 Jul 2019 swing high area of 29000 (also 76.4% Fibonacci retracement of the previous decline from 03 May high to 15 Aug 2019 low).
Key elements
- The 6% up move from 10 Oct 2019 low of 25475 has stalled right at the minor pull-back resistance of the former ascending support from 15 Aug 2019 low at 27000/27070 which also confluences closely with the 13 Sep 2019 minor swing high area and the medium-term descending trendline from 03 May 2019 high acting as a resistance at 27400.
- The daily RSI oscillator has remained below a significant corresponding resistance at the 64-level coupled with a bearish divergence signal seen in the 4-hour Stochastic oscillator at its overbought region. These observations suggest that recent upside momentum has started to wane.
- The 27070/27400 medium-term resistance zone also coincides closely with a Fibonacci retracement/expansion cluster which indicates a potential reversal zone.
ASX 200 – Mix elements
click to enlarge charts
Key Levels (1 to 3 weeks)
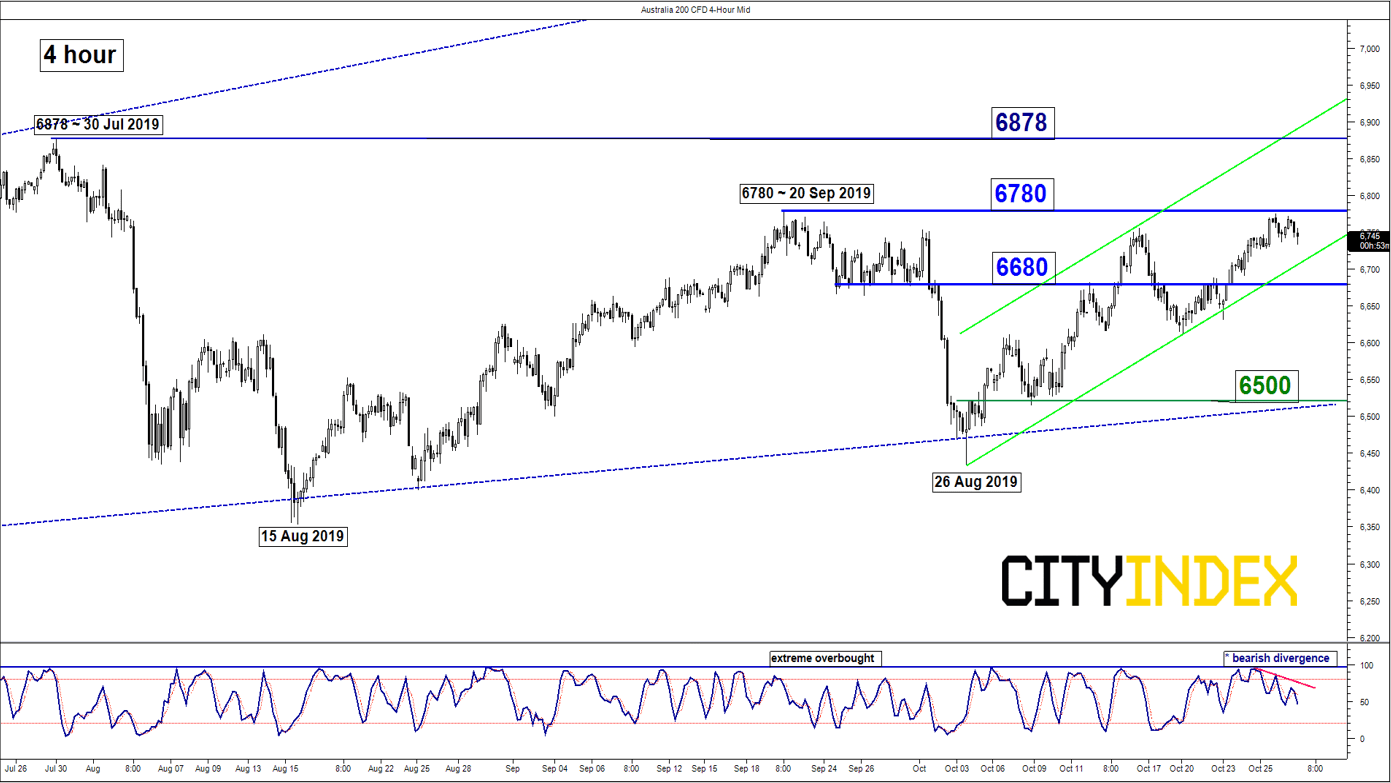
Resistances: 6780 & 6878
Supports: 6680 & 6500
Directional Bias (1 to 3 weeks)
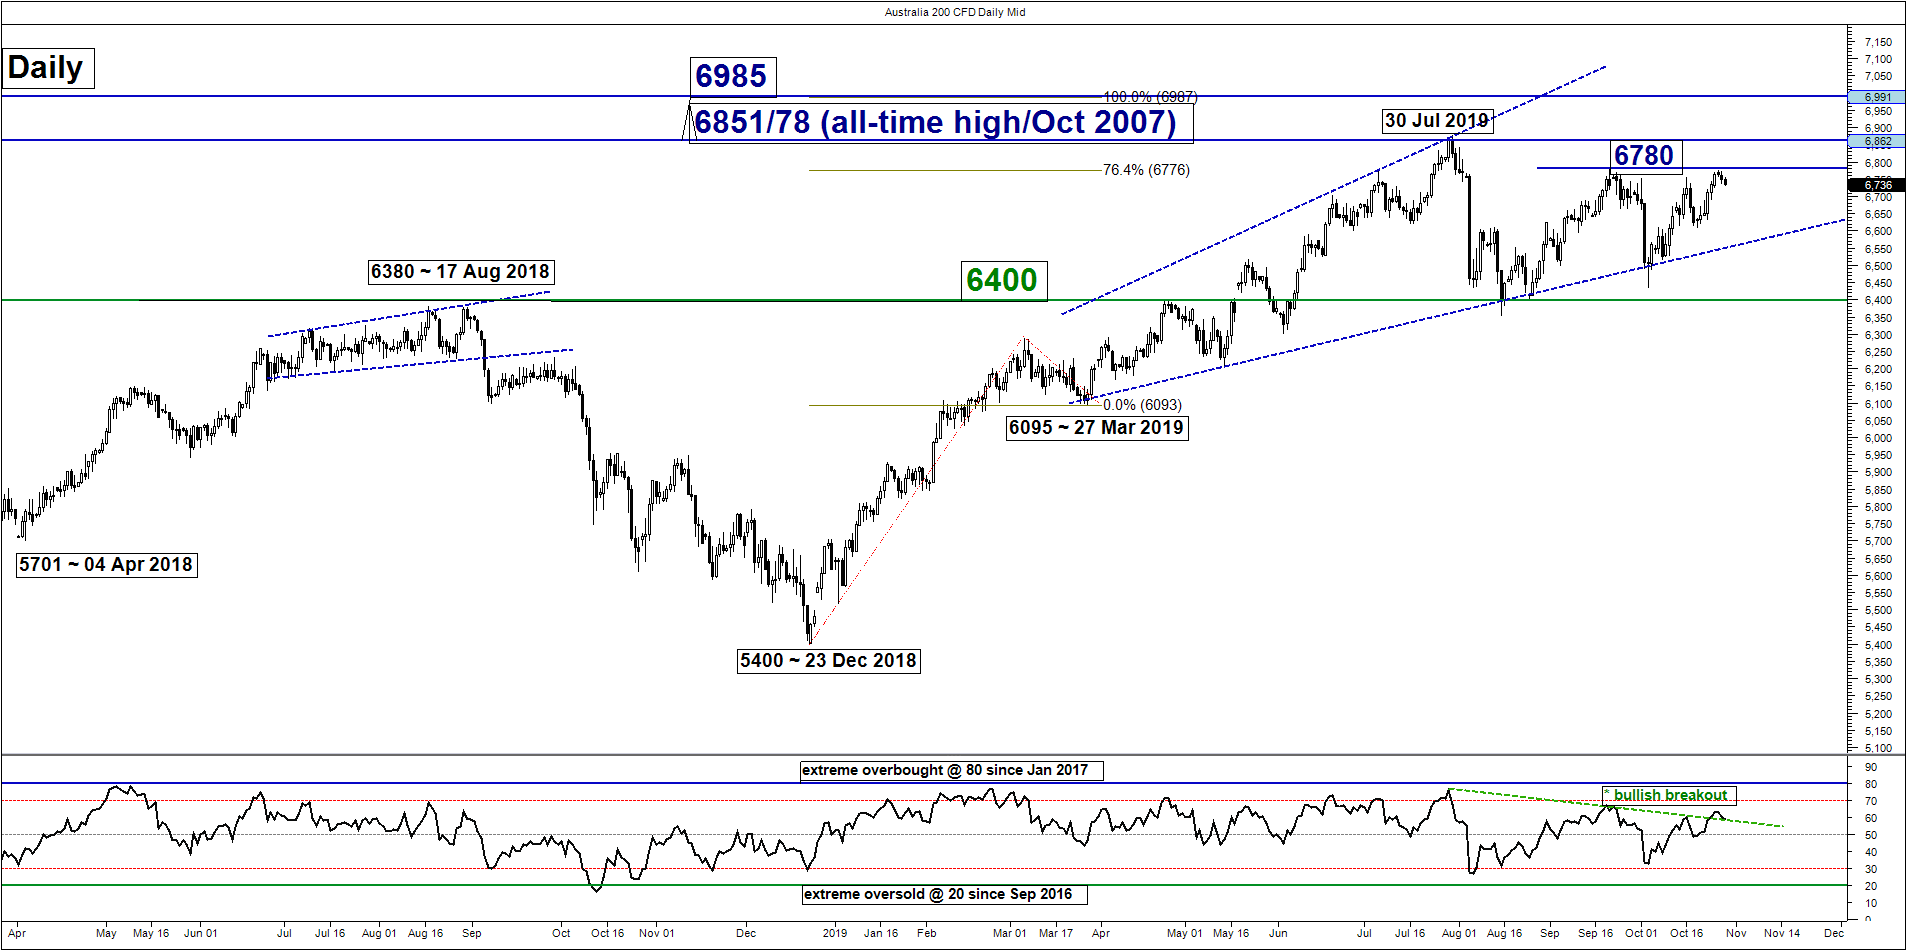
The Australia 200 Index (proxy for the ASX 200 futures) has staged the expected push up and hit the 6750 target/resistance.
Mix elements now, prefer to turn neutral now between 6780 and 6680. A break below 6680 revives a slide towards the “Expanding Wedge” support at 6500, a major configuration in place since 27 May 2019 low.
On the flipside, a clearance above 6780 sees a push up to retest 30 Jul 2019 intraday high of 6878 where it has challenged its current all-time high level of 6851 printed in Oct 2007 but failed to have a daily/weekly close above it.
DAX – At risk of multi-week mean reversion decline
click to enlarge charts
Key Levels (1 to 3 weeks)
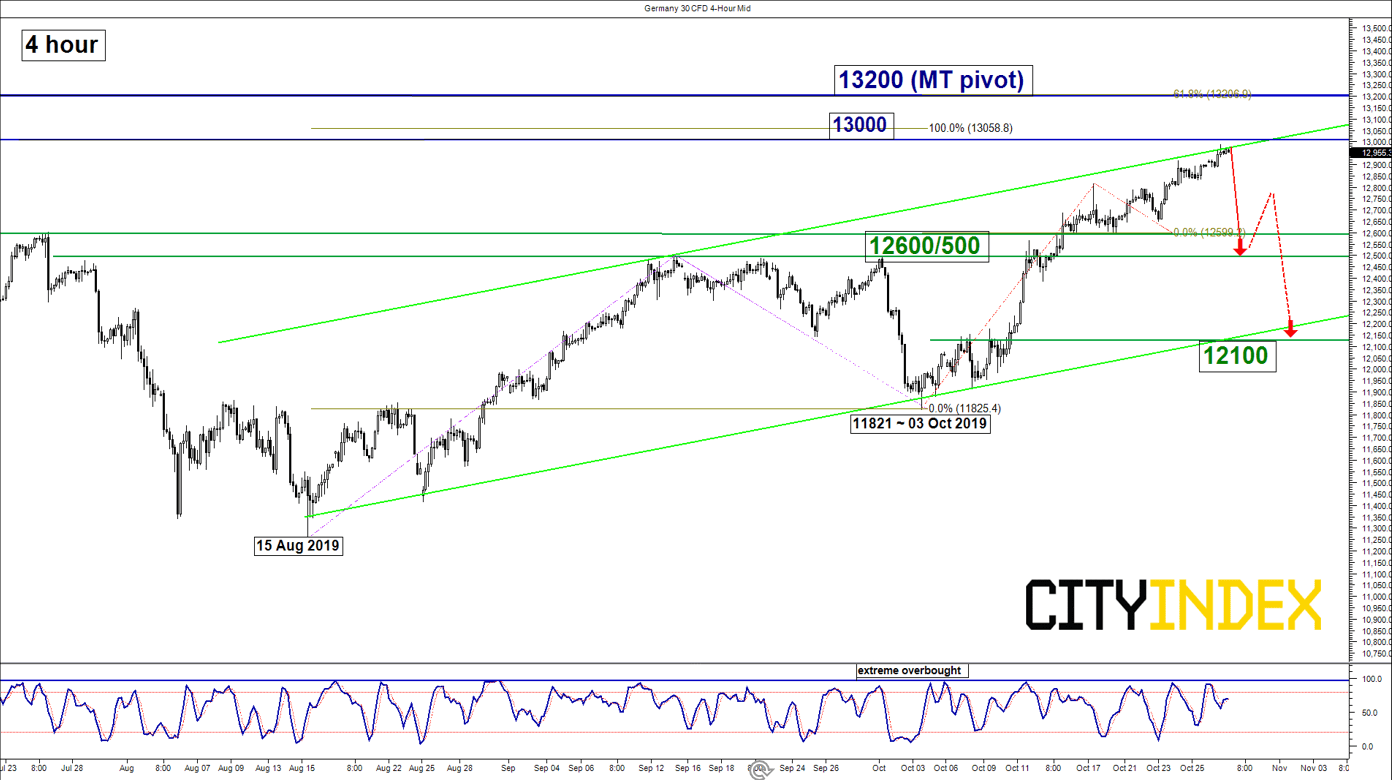
Intermediate resistance: 13000
Pivot (key resistance): 13200
Supports: 12600/500 & 12100
Next resistance: 13600 (all-time high)
Directional Bias (1 to 3 weeks)
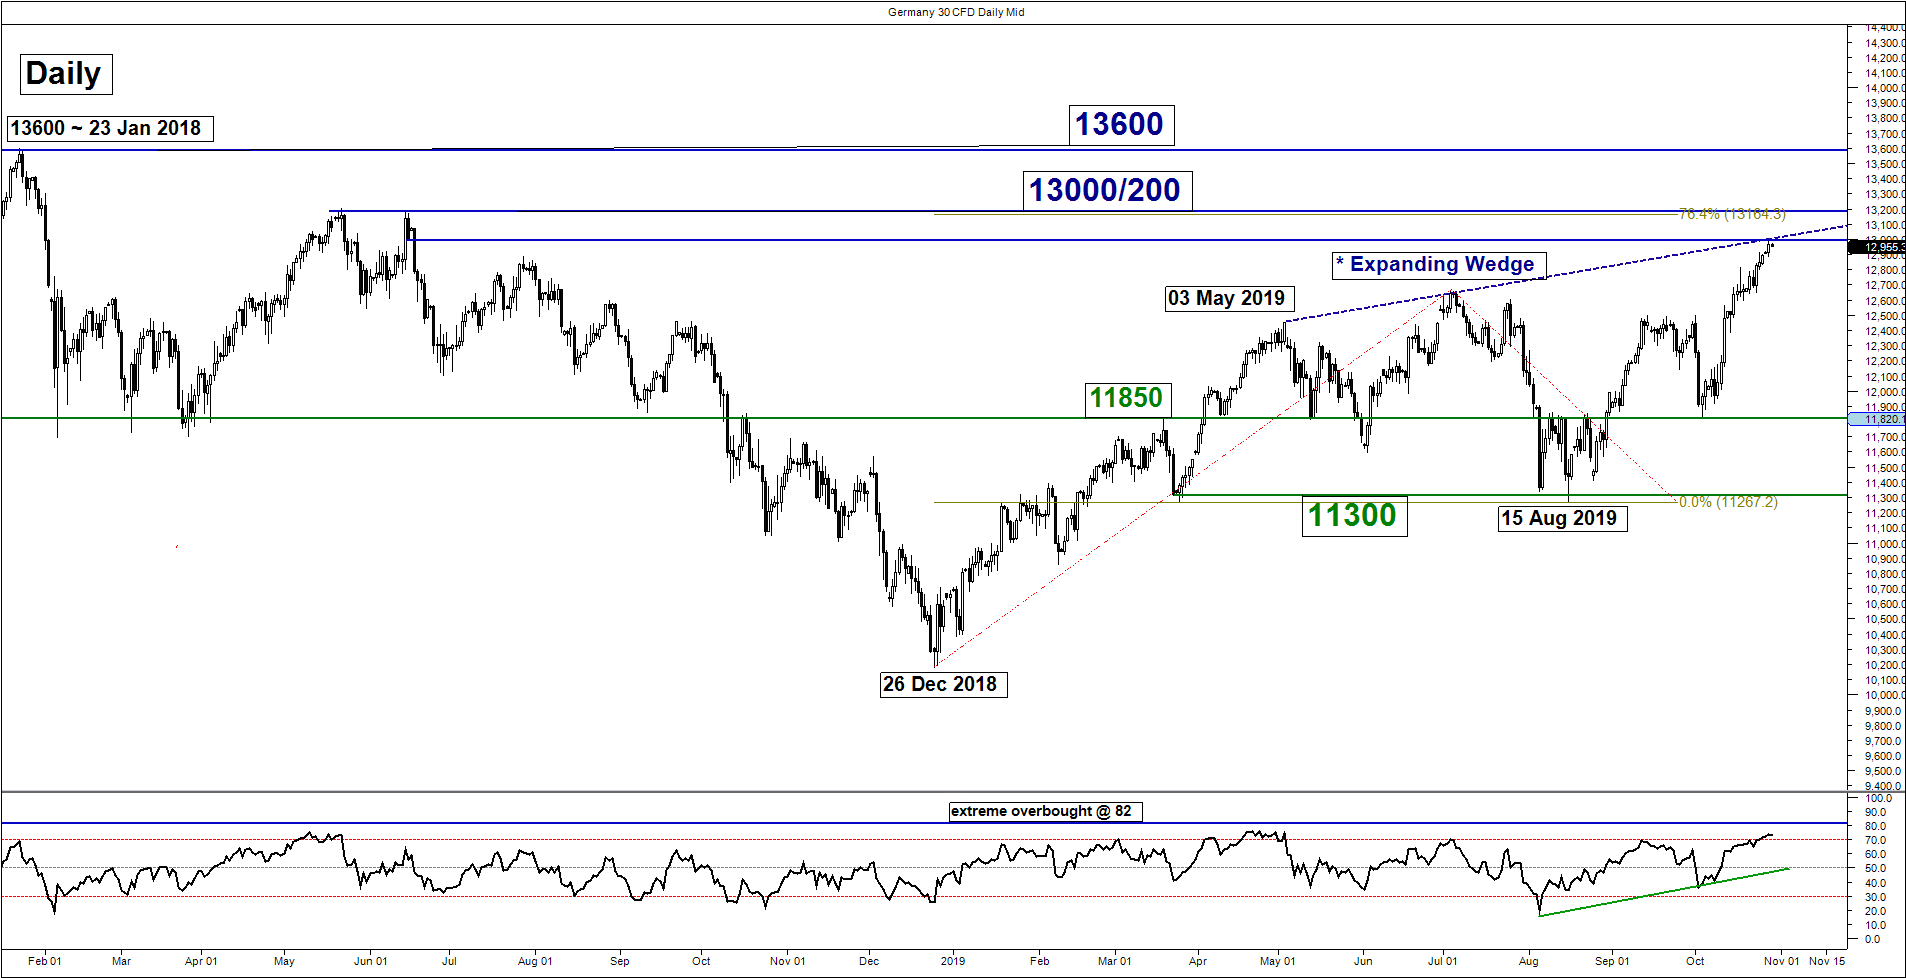
The Germany 30 Index (proxy for the DAX futures) has staged the expected rally and hit the 12800 target/resistance as per highlighted in our previous report.
Flip to bearish bias in any push up below the 13200 key medium-term pivotal resistance for a potential corrective decline to retest 12600/500 (the former minor swing high area of 13 Sep/01 Oct 2019 in the firs step. A break below 12500 sees a further slide towards 12100 support next (the lower boundary of the minor ascending channel from 15 Aug 2019 low & former minor swing high areas of 08/09 Oct 2019).
On the other hand, a clearance with a daily close above 13200 sees an extension of the up move to test the current all-time high level of 13600.
Key elements
- The 15% rally from 15 Aug 2019 swing low area of 11300 has reached the medium-term “Expanding Wedge” range resistance at 13000 which is also right below the 22 May/14 Jun 2018 swing low area of 13200.
- The 13000/13200 medium-term resistance zone also confluences with a Fibonacci expansion cluster and the upper boundary of a minor ascending channel in place since 15 Aug 2019 low. Thus, it increases the odds of a potential reversal zone at 13000/13200.
- The daily RSI oscillator and the shorter-term 4-hour Stochastic oscillator has almost reached their respective extreme overbought levels. These observations suggest the recent up move in price action is overstretched where it now faces the risk of a mean reversion decline.
Latest market news
Yesterday 01:23 PM
Yesterday 06:01 AM
April 18, 2024 11:27 PM
April 18, 2024 04:46 PM
Latest Australia 200 articles
February 15, 2024 11:33 PM
February 15, 2024 01:42 AM
February 14, 2024 05:39 AM