Sterling surges as resilience of UK economy continues to surprise
The pound took a pounding in the lead up to and aftermath of the June 23 EU referendum. But in recent weeks, it has staged […]
The pound took a pounding in the lead up to and aftermath of the June 23 EU referendum. But in recent weeks, it has staged […]
The pound took a pounding in the lead up to and aftermath of the June 23 EU referendum. But in recent weeks, it has staged a remarkable recovery, even though the Bank of England has decided to cut interest rates to near zero and restarted QE. As well as the impact of profit-taking, the turnaround has been largely due to a marked improvement in UK data which has confounded many analysts who had feared the economy would crumble after the Brexit vote. But so far, there has been little or no signs of that– if anything, the opposite has happened. We must remember though that nothing has changed just yet; it may well do once we actually leave the EU or when the Article 50 is triggered.
But that’s a worry for another day. Today, the streak of positive data continued as the August manufacturing PMI surged above the boom/bust threshold of 50.0 to record its strongest monthly rise in 25 years. At 53.3, it easily beat expectations for a 49.1 reading. Consequently, the pound surge higher while Gilt yields also jumped, reaching 4-week highs. If the trend of stronger data continues then we may well see further appreciation in the pound, especially against currencies where the central bank is still uber-dovish, such as the euro or the yen.
Indeed, the Bank of Japan has indicated that it is ready to do more in order to meet its inflation target (and get its credibility back). Thus the GBP/JPY, having suffered a big drop in recent months, could be on the verge of a sharp recovery.
Technical outlook: GBP/JPY
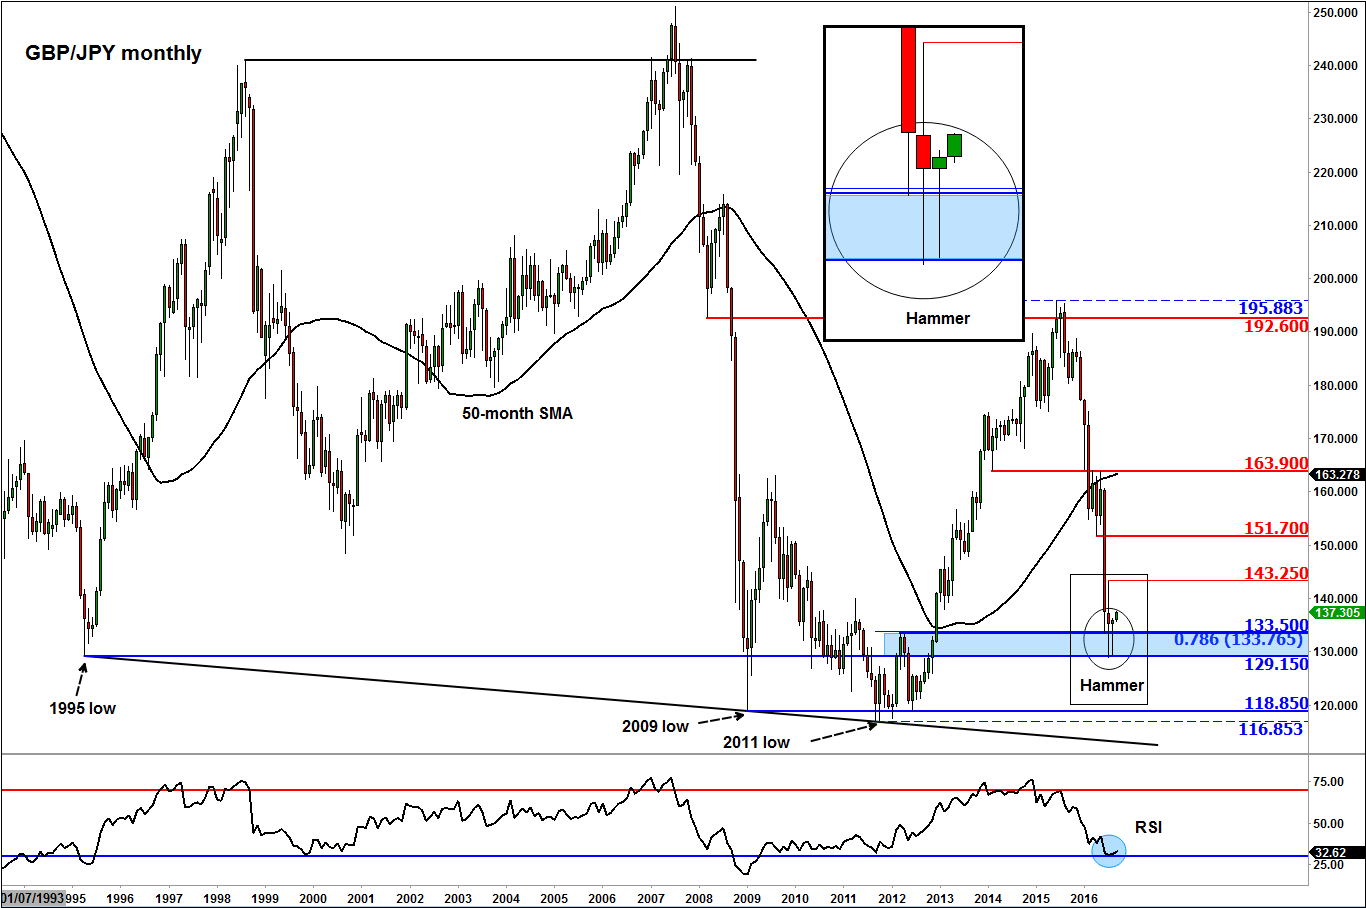
At the start of each month, it is not a bad idea to scroll through your monthly charts on the markets that you normally trade. Even if you don’t trade off the monthly charts, you will get to see the long-term support and resistance levels and from time to time patterns emerge that may have a strong influence on direction. The GBP/JPY chart is a good example. As can be seen, the cross formed a bullish hammer candle in the month of August at a major support zone in the 129.15-133.50 region.
The hammer pattern is usually formed at the low of major downtrends which often precedes major rallies, especially if observed on higher time frames, which is the case with this pair. What makes this particularly bullish is the fact that Bank of England’s decision to further loosen its policy last month failed to cause the GBP/JPY to drop below the July low. We have also seen a marked improvement in UK data, while the Bank of Japan has repeatedly hinted at more QQE. So it is not just a technical development.
But focusing solely on the technical aspects, it is also encouraging from a bullish point of view to see the 129.15-133.50 key area hold as support. Likewise, the pullback of the momentum indicator RSI to the “oversold” levels of around 70 further bolsters the bullish argument. But of course these are just a few technical indications and the fundamental aspects for this pair could turn out for the worse in the coming months. But for now at least, it looks like the bulls are back in charge and so we may see price stage a nice recovery from here. The bullish argument will become invalid should the GBP/JPY form new multi-year lows in the coming months. Some of the key support and resistance levels to watch are shown on the chart in blue and red colours.