


The U.S. benchmark index looks set to flirt with its critical trend gauge again sometime soon
Among technical chart indicators that have appeal beyond the realm of seasoned traders, perhaps the S&P 500’s 200-day moving average is ‘up there’. If anything, since the global stock market’s expansion began from a March 2009 bottom, the gauge of the U.S. market’s health over a business year has gained even greater prominence. Over that stretch, the fiercest market corrections—let’s say when the VIX Volatility Index hit 40 or higher—have coincided with SPX ‘officially’ no longer in an uptrend. In other words, when the S&P 500 was well below its 200-day average.
So, from a technical chart perspective, there are well-founded reasons to take the S&P 500’s latest approach to the threshold very seriously.
More positively, the import of the 200-DMA, cuts both ways. Chiefly, the gauge is a well-known support, with demonstrable resilience. With U.S. economic counters conspicuously holding their ground, by and large, whilst those in other developed economies turn definitively lower, it may be some time before SPX’s 200-DMA sounds any alarms. Note that when SPX approached its 200-DMA in March and June it rebounded sharply.
The difference between then and now is that that the U.S. stock market gauge is rounding off a month of sideways consolidation. We can demarcate the range between the 2945.50 high of 2nd August and 2822.12 low a day later. Since then, price has narrowly avoided going lower on at least three clear occasions, but it has not managed to get higher either.
Classically, technical analysis tends to view moves as stronger if they are preceded by a period when energy has metaphorically been building up.
Further circumstantial negatives include that closely related peer indices of the S&P 500 are faring worse, relative to their 200-day moving averages. The equal-weighted S&P 500, Midcap 400, Small Cap 600 and Russell 2000 have all fallen significantly more this month than SPX.
As for SPX’s near-term outlook, the lower bound of the range outlined above is the most critical level.
Note that the 3rd August low of 2822 we mentioned was an almost identical echo of a low on 6th June. Raising the stakes even higher, that low was the launch point of SPX’s most confident vault in the second half of the year so far. The move peaked seven weeks later and 7.3% higher at 3013 on 26th July.
Any break down and out of the range will heighten expectations of a challenge against the index’s 200-day moving average.
Unsettling vibrations—AKA volatility—can only ratchet higher under those circumstances.
S&P 500 – daily
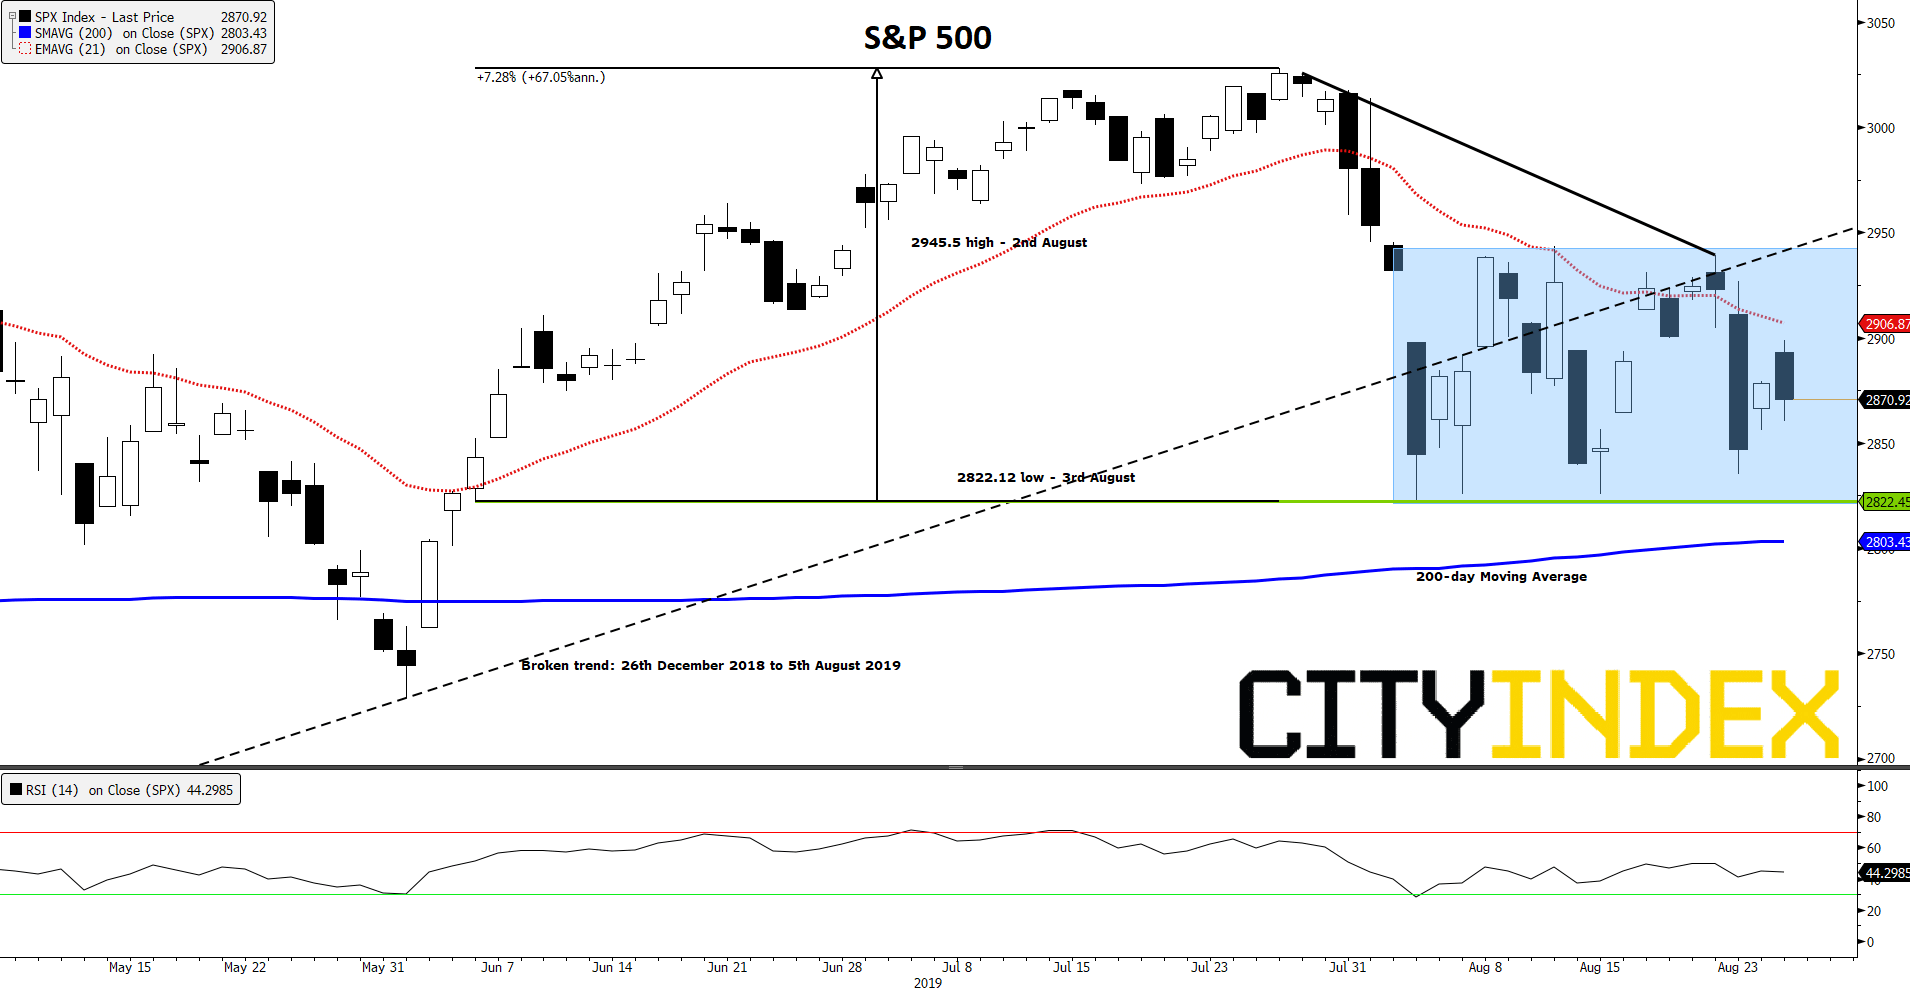
Source: Bloomberg/City Index
Latest market news
Yesterday 01:23 PM
Yesterday 06:01 AM
April 18, 2024 11:27 PM
April 18, 2024 04:46 PM
Latest Indices articles
April 18, 2024 04:46 PM
April 17, 2024 11:00 AM
April 16, 2024 08:00 PM
April 16, 2024 04:54 PM