


- Spanning 3 sessions, the S&P500’s pullback from its highs was short-lived, yet by its own standards quite deep at -2.7%. Still, support was found at 3065 and prices are now consolidating just below record highs once more. Unless Trump unveils tariffs on China over the weekend, we’d expect it to break to new highs. Yet we doubt he’ll want to knock equities from their perch heading into the new year, so perhaps they’ll be delayed again anyway.
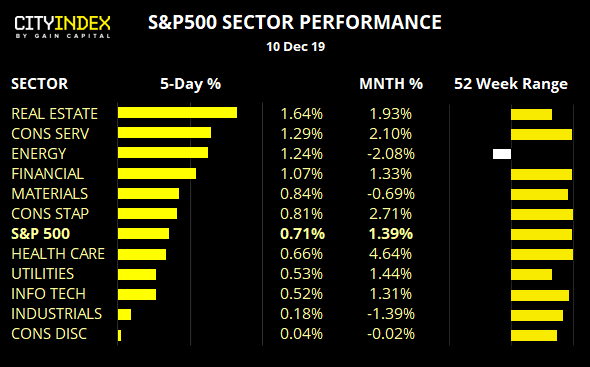
- All sectors have remained in the black over the past five session, with real estate, consumer services and even energy leading the way.
- 6 out of the 11 sectors trade just off record highs, which underscores the strength of this bullish trend.
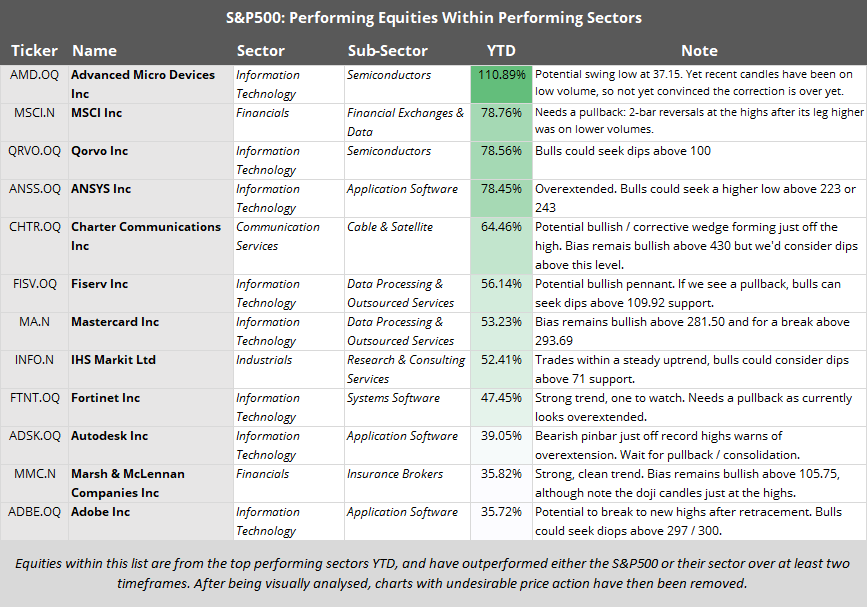
- With the index poised to break to new highs (sooner or later) then the relative strength watchlist will focus on outperforming stocks for now.
- Chart below also include ideas that are on price action only, so may not factor in whether it’s in an outperforming/underperforming sector.
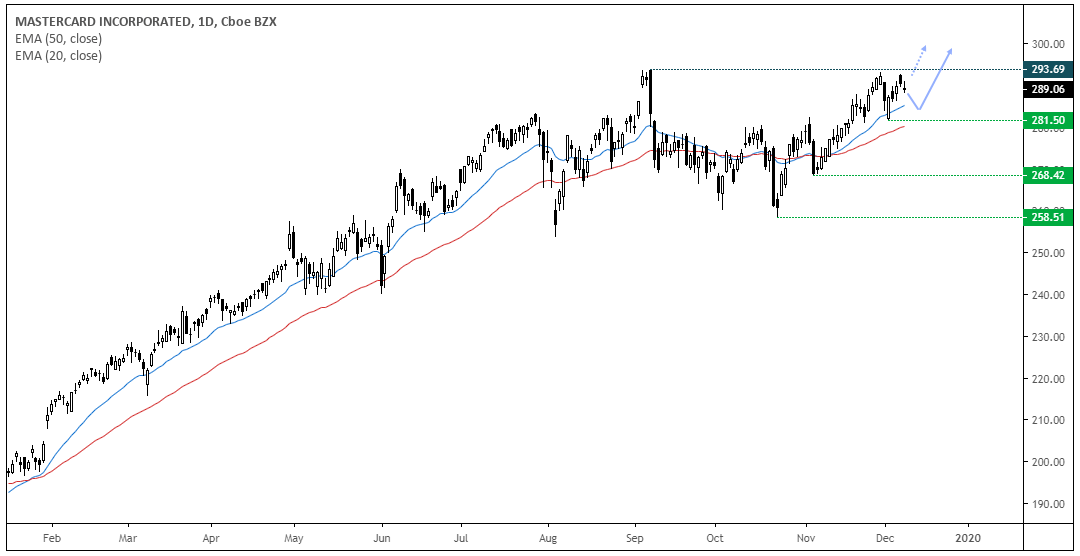
Mastercard CFD/DFT (MA): Trading just off record highs amid a multi-year bull run, Mastercard could be poised for another bullish breakout. A tall bullish candle marks a likely swing low at 281.50, which found support between the 20 and 50-day eMA. Whilst thinner volumes over recent sessions warn the breakout may not be immediate, given the strength of the trend from the 258.51 low, an eventual break higher is favoured.
- Bias remains bullish above 281.50
- Bulls can wait for a break above 293.69 or seek to buy dips above 281.50 if confident we’ll eventually see a break to new highs.
- A break below 281.50 warns of a wider sideways correction between 258.51 – 293.69, which could suit counter-trend traders until bullish momentum returns.
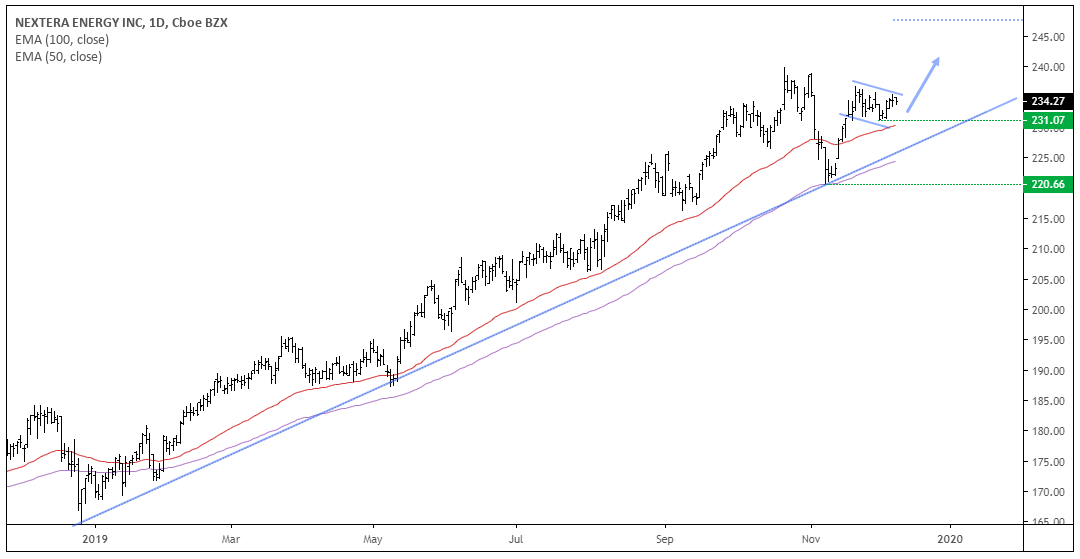
NextEra Energy Inc CFD/DFT (NEE): Its parabolic trend continues (zoon out to see the chart from the 1990’s and you’ll see what we mean) and price action is considering a break to new highs. Having rebounded from 220 support at the trendline, price action is now carving out a bullish flag which, if successful, projects a target around 248.
- Bias remains bullish above the trendline, although we’d prefer to see 231 hold as support to assume a bullish flag remains in play.
- Traders can either wait for a break of the bull flag or, if confident it could revert to its trend, enter during the consolidation period.
- As it’s a long-term bullish trend, an upside target could remain open. Although the bull-flag target around 248 could also be considered.
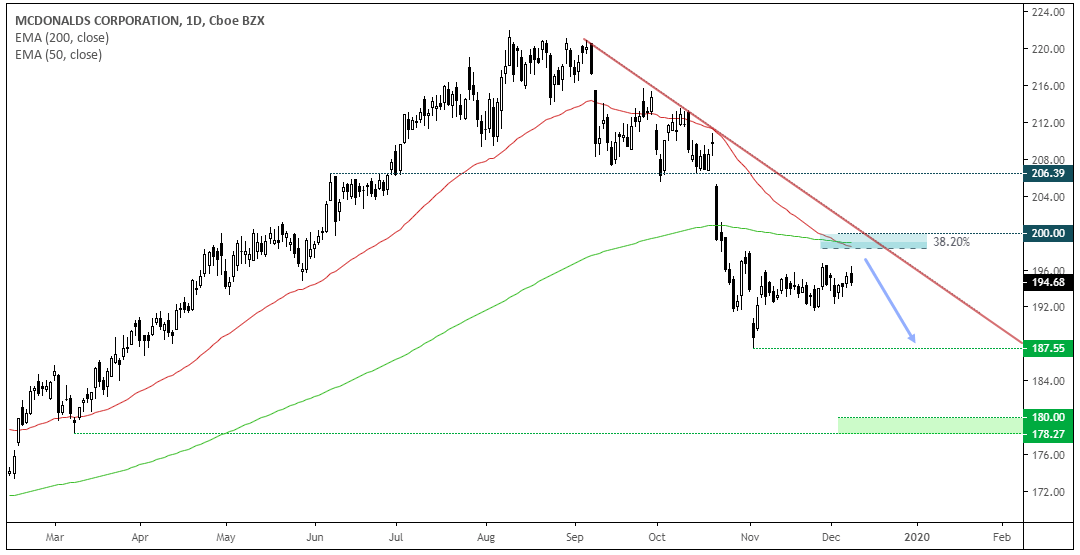
McDonald's Corp CFD/DFT: As much as we love them, we’re bearish on burgers whilst McDonalds remains below 200. Having carved out a top pattern between June through October, prices gapped topped proceeded to trade below the projected target around 190. The 50-day eMA ha crossed below the 200-day eMA, both of which are capping as resistance around the 38.2% Fibonacci level and the round number 200. Prices are now consolidating below a cluster of resistance around 200, so we’re waiting for this to break lower or complete its correction beneath the bearish trendline.
- Bias remains bearish beneath the resistance cluster around 200
- Whilst this could morph into a bearish triangle, it could just as easily pull back towards the trendline / resistance cluster before topping out. Therefore, a wider stop is something to consider to allow ‘breathing room’ around the position.
- Initial target is the 187.55 low and then 180.
Price Action Update:
- Advanced Micro Device CFD/DFT: After gapping lower through support then breaking higher, it would have been difficult to gain a decent entry. This is on the backburner until the picture becomes clearer (although give its longer-term uptrend, we’ll continue to monitor its potential for a trough)
- United Technologies CFD/DFT: The bias for a pullback has played out, albeit a little deeper than anticipated as it dipped beneath 144.35 support. Yet support has been found at the 50-day eMA and the bearish days were on lower volume to suggest the declines were indeed a correction. Bulls could either wait for a break above 149.81 or a consider a break of a bearish channel. Ultimately, we’d prefer to at least see a bullish candle on the daily as, for far, each candle has been bearish.
- Apache Corp CFD/DFT: Due to the large gap down at the open, one would have to have already been ‘in it to win it’. So whilst the directional bias was correct, the gap was unfortunate. It remains on the bearish watchlist for another entry, so perhaps bears could consider fading into minor rallies below 22.19 with view for it to break to new lows.
- Nisource CFD/DFT: The bias remains bearish although retracement from its lows has recycled higher, leaving a potential ABC correction to monitor (and as volumes on the minor rebound are low it also points towards corrective price action). Whilst too soon so say it has finally completed, yesterday’s bearish candle below 27 resistance (and the 38.2% Fibonacci ratio) are encouraging so bears should keep this on their watchlist for signs of bearish momentum to return.
Latest market news
Yesterday 03:00 PM
Yesterday 01:12 PM
Yesterday 11:14 AM
Yesterday 08:28 AM
April 24, 2024 03:30 PM
Latest Shares market articles
November 2, 2023 01:41 PM
November 1, 2023 01:33 PM
October 31, 2023 01:15 PM
October 31, 2023 10:24 AM