


The S&P E-mini closed the session with a bullish engulfing candle yesterday and has broken to an intraday high in Asia, on the back of positive news on the US-China trade negotiations. According to President Trump, China has indicated trade talks are advancing, which raises hopes that a trade deal could be signed in Chile next month.
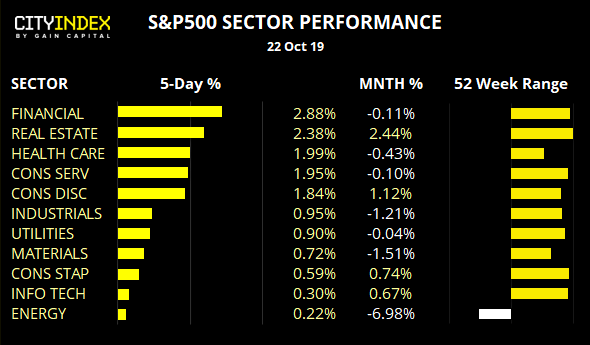
Still, the &P500 has reported YoY decline in earnings for a third quarter, which is currently -4.7%. Whilst revenues are higher at 2.6%, it points towards as squeeze on net profit margins for Q3. So it’s not all rosy at the highs.
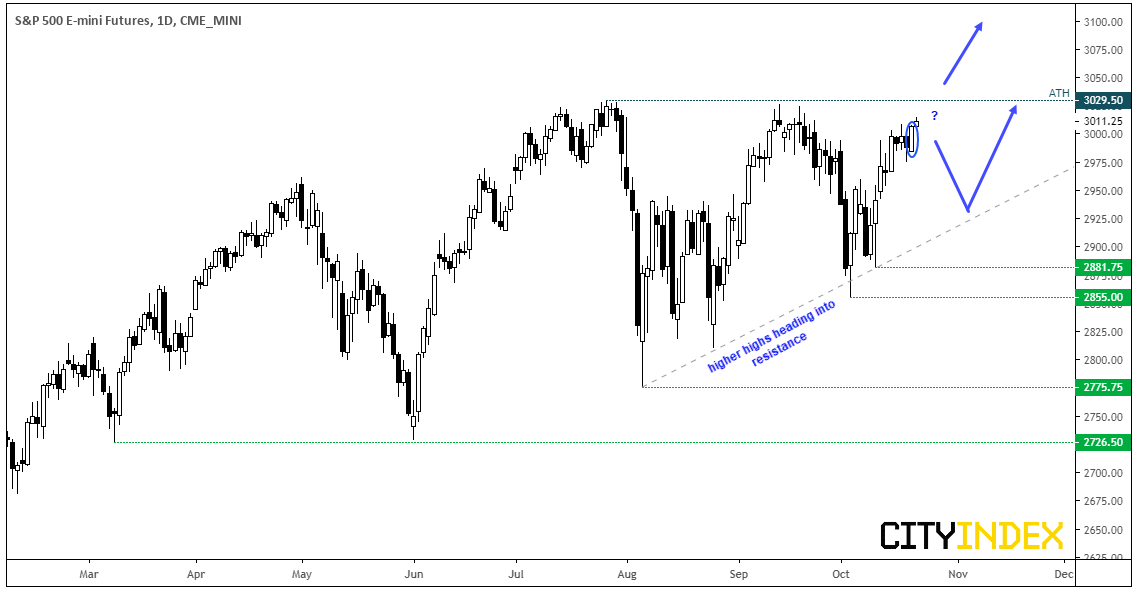
From a technical standpoint, it trades just 19 points from record highs which has bulls on high alert for a fresh breakout. Yet there’s also the potential for this to morph into an ascending triangle, which leaves room for at least another cycle lower (with a higher low or two) before breaking out.
- The reward to risk potential is unappealing for bulls, being so close to the all-time highs, Therefor, they may want to wait for a break above 3029.50 for even a daily close, before assuming a breakout is underway.
- Bears could also consider fading into any minor rally below key resistance. However, keep in mind this is counter to the long-term uptrend so likely carries greater risk.
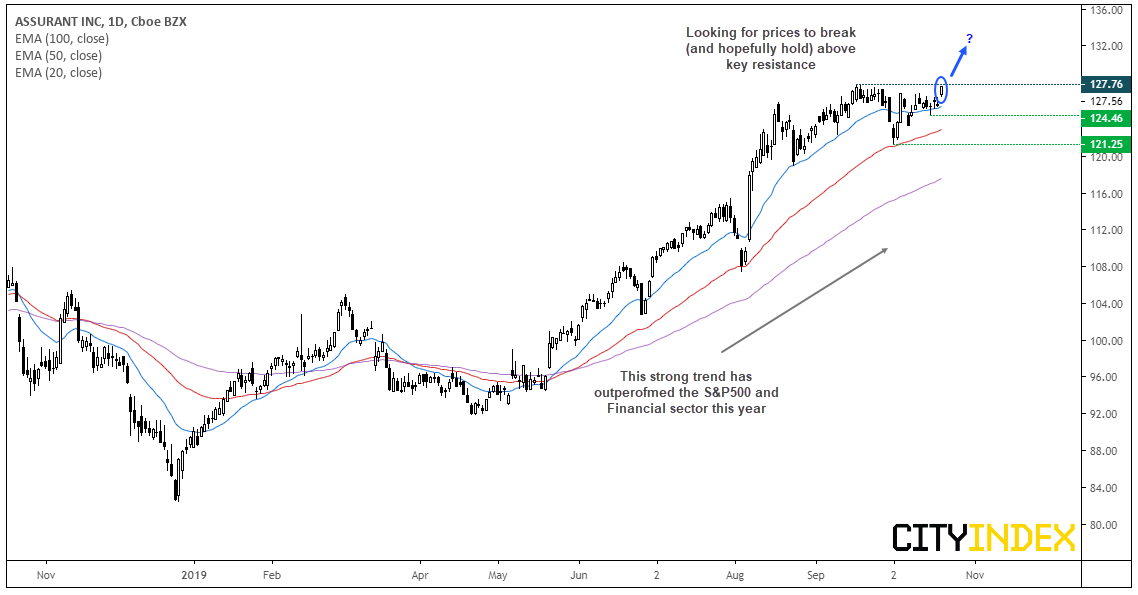
Assurant CFD/DFT: Currently around 25% up for the year, this household insurance company has outperformed both the S&P500 and financial sector. Structurally, the daily trend is clearly bullish and is on the cusp of breaking to a new 52-week high. The 50-day eMA provided support and marks the potential swing low, and yesterday’s gap higher saw it gap out of compression. Given we’ve just seen over a month of consolidation at the highs, there are no clear signs of overextension despite it sitting near its record highs.
- A clear break (and / or close) above 127.76 assumes bullish trend continuation.
- The trend remains bullish above 121.25, although we could also step aside if momentum reverses and breaks beneath the small doji around 124.46
- Being near record highs, traders could use an open target if trading the daily timeframe
- Intraday momentum traders could also monitor this for a break higher, whilst swing traders could wait to see if the 127.76 area holds as support
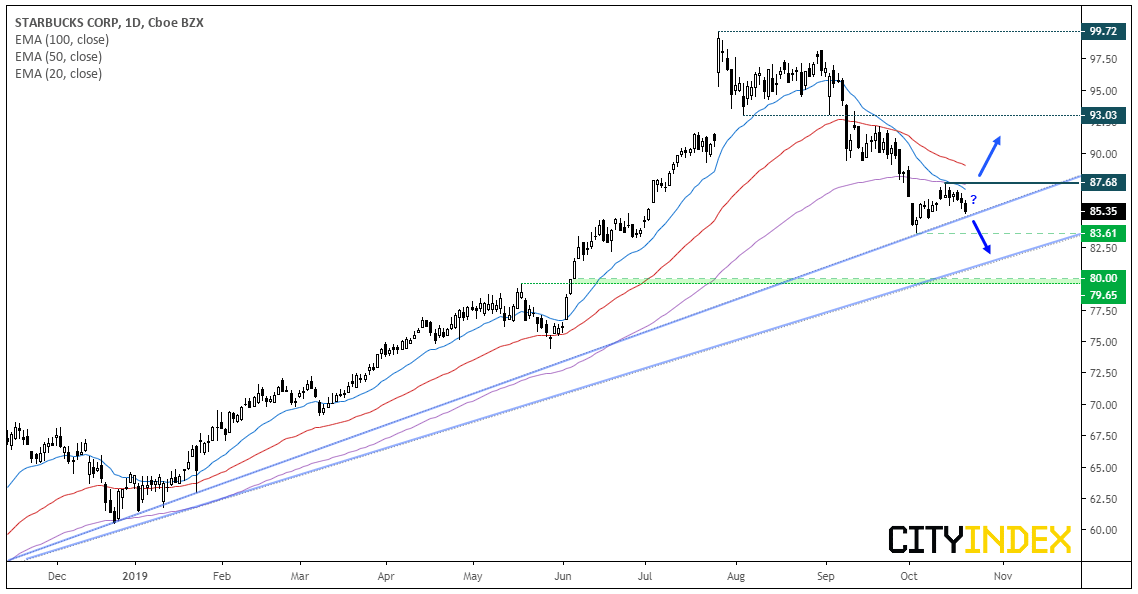
Starbuck Corp CFD/DFT: The price action on SBUX has caught our eye, as it’s at a technical juncture. From June ’18 to July this year, it traded in a very strong, almost parabolic bullish trend. Yet since peaking just below 100, a counter-trend move has unfolded with a series of lower lows and highs and its recent pullback has found resistance at the 100 and 20-day eMA’s. Furthermore, the 20-day eMA has crossed blow the 100 and the 50-day also points lower. Whilst this would be an appealing setup to bearish swing traders, prices have stalled at the September ’18 trendline.
- A break of the Sep ’18 trendline confirms a resumption of the bearish trend from the 2018 high and target the 83.61 low initially, and the June ’18 trendline and the high around 80.
- Bulls could wait to see if the bullish trendline holds and momentum breaks above the 87.68 high. This would also break back above the 20 and 100-eMA’s and create a higher low and higher high.
Price Action Update:
Apple Inc CFD/DFT: After finding support at the prior ATH’s around 233, its closed to fresh new highs and keeps the bullish channels very much alive and well. With no clear signs of a top, the trend points high and could be an equity for intraday momentum traders to also consider.
Applied Materials CFD/DFT: The Cup and handle pattern could still be in play although, ideally, we should have seen a direct breakout. Instead, Thursday’s bearish hammer closed back just below the original breakout level to warn of a hesitancy to break higher, although the overall structure remains bullish. Support has been found at the 20-day eMA, so a break below 51.00 warns of a deeper correction against the dominant trend (and perhaps towards the December trendline). Whereas a break above 53.25 assumes bullish continuation.
Cisco Systems CFD/DFT: A downside break remains the bias as part of a head and shoulders top, whilst prices remain beneath the 48.13 high. Whilst prices have made a half-hearted attempt to move higher, momentum lacks conviction. Ultimately, it remains in the watchlist for a larger downside move but we’re not on high alert of a sell signal just yet.
Related analysis:
S&P500: The Long And Short Of It | Cisco, Welltower, Applied Material
FTSE Pauses At Resistance | CWK, CTEC, IMB
Latest market news
Yesterday 11:09 PM
Yesterday 11:01 PM
Yesterday 04:00 PM
Yesterday 01:15 PM
Yesterday 11:30 AM
Latest Shares market articles
November 2, 2023 01:41 PM
November 1, 2023 01:33 PM
October 31, 2023 01:15 PM
October 31, 2023 10:24 AM