


July 11, 2019 2:13 AM
Overnight U.S. equity markets voted that bad news is, in fact, good news, rallying after downbeat comments contained in Fed Chairman Powell’s testimony to the U.S. Congress and in the minutes from the Feds June meeting.
In prepared remarks to the U.S. Congress, Powell said that “it appears that uncertainties around trade tensions and concerns about the strength of the global economy continue to weigh on the U.S. economic outlook” and then added, “inflation pressures remain muted”. Apparent confirmation that last week’s bumper U.S. job reports and the G20 trade truce with China have not derailed the case for a July rate cut.
Earlier this week we wrote that “the most likely outcome at the July 31st FOMC meeting is for a 25bp cut delivered in conjunction with dovish guidance” and that “Powell’s testimony this week should reflect this.” Hence, we aren’t surprised by the dovish tone emanating from overnight events.
However, delivering a pleasant surprise to equity market bulls (and a set back to U.S. dollar bulls) Powell refused to rule out the possibility of a 50bp cut at the July meeting. Once again, the interest rate market has 32 bp of cuts priced for the July meeting, reflecting the increased possibility of a 50bp cut.
Turning now to the charts. After the overnight rally, the S&P500 is back trading above the big round number resistance at 3000 and on course for a test of the more critical resistance zone 3030/3050 area. This resistance zone comes from the broken uptrend line, from the 2016 low and has proved to be a stumbling block for the market on at least three previous occasions, twice in 2018 and then again in May 2019.
Given its history, traders are likely to be very quick to jump ship on any signs of rejection from the 3030/50 resistance level. Conversely, should the S&P500 close above 3050, it would validate the bad news is good news reaction viewed overnight and allow a push towards the next upside target at 3150.
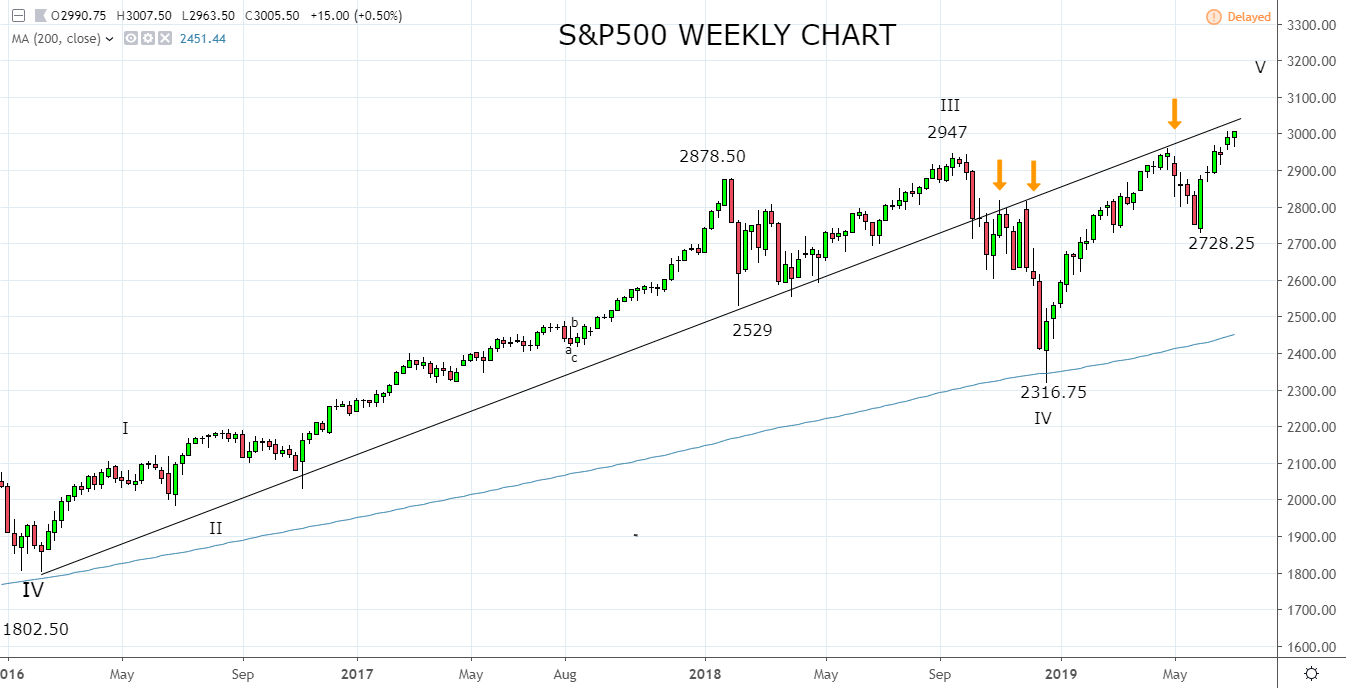
Source Tradingview. The figures stated are as of the 11th of July 2019. Past performance is not a reliable indicator of future performance. This report does not contain and is not to be taken as containing any financial product advice or financial product recommendation
Disclaimer
TECH-FX TRADING PTY LTD (ACN 617 797 645) is an Authorised Representative (001255203) of JB Alpha Ltd (ABN 76 131 376 415) which holds an Australian Financial Services Licence (AFSL no. 327075)
Trading foreign exchange, futures and CFDs on margin carries a high level of risk and may not be suitable for all investors. The high degree of leverage can work against you as well as for you. Before deciding to invest in foreign exchange, futures or CFDs you should carefully consider your investment objectives, level of experience, and risk appetite. The possibility exists that you could sustain a loss in excess of your deposited funds and therefore you should not invest money that you cannot afford to lose. You should be aware of all the risks associated with foreign exchange, futures and CFD trading, and seek advice from an independent financial advisor if you have any doubts. It is important to note that past performance is not a reliable indicator of future performance.
Any advice provided is general advice only. It is important to note that:
- The advice has been prepared without taking into account the client’s objectives, financial situation or needs.
- The client should therefore consider the appropriateness of the advice, in light of their own objectives, financial situation or needs, before following the advice.
- If the advice relates to the acquisition or possible acquisition of a particular financial product, the client should obtain a copy of, and consider, the PDS for that product before making any decision.
Latest market news
Today 08:33 AM