Six major bearish signals for the Dow Jones index
A severe decline for the US markets may be about to commence and traders may want to consider several technical warning signals. So far the […]
A severe decline for the US markets may be about to commence and traders may want to consider several technical warning signals. So far the […]
A severe decline for the US markets may be about to commence and traders may want to consider several technical warning signals.
So far the Dow Jones index has managed to trade higher into the month of August to test the May 2012 high of 12338. But once again the index has not managed to penetrate the resistance barrier of 13317 which has been a key level for the index.
Since the October 2011 rally which has so far gained 28.20% the Dow Jones is now showing several signs that may be a precursor to a rally about to fizzle out and start a correction to the downside. What is interesting is that a similar situation had occurred in October 2007 where Alan Greenspan had provided positive comments on the state of the economy. This was then followed by a major decline which lasted 17 months.
On a Monthly chart we have technical resistance at 13317 and the index has failed three times so far. Currently this month registers as the fourth attempt. Historically when we have seen fourth attempt failures, this can lead to major moves in the markets. With the Daily chart, technical resistance comes in at 13060–13190 which has also seen the index fail to hold onto. Both the Monthly and Daily chart resistance levels are signalling a potential weakness at current price levels.
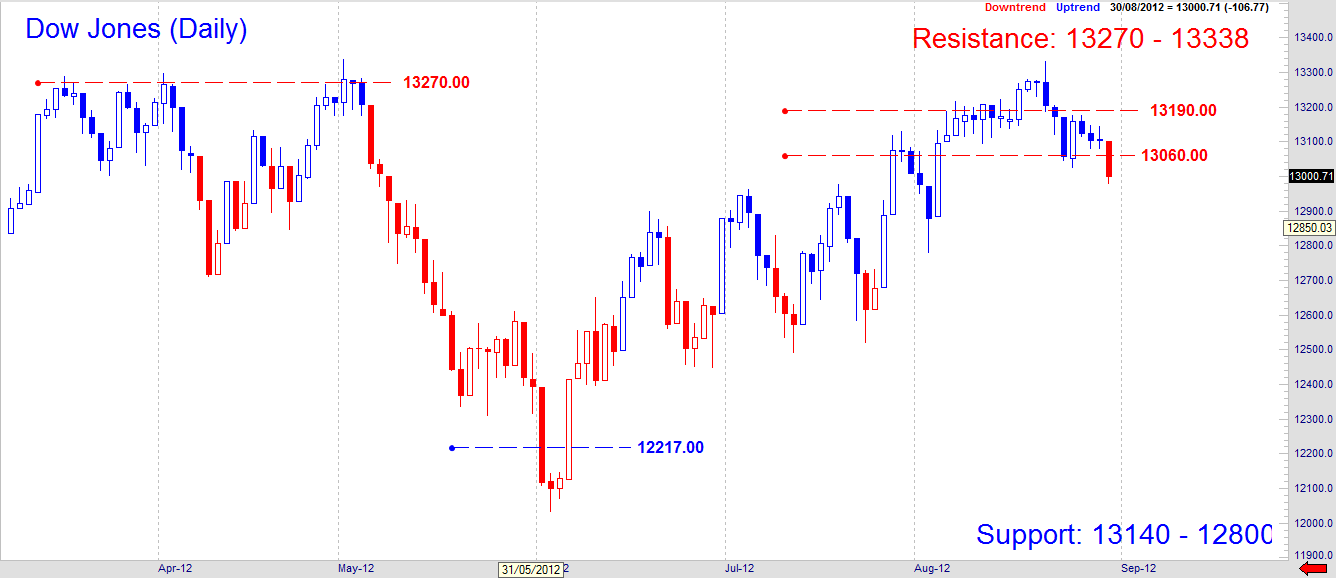
Dow JonesDaily
Next we also have technical divergence on several indicators and on multiple time frames. This is where we see a disagreement between price and indicators where they move in opposite directions. The recent rally in the market to the upside had not been followed through with momentum indicators, which suggests that the rally on low volume was not a conclusive move. Strong moves are in sync with price and positive momentum.
Another signal which has caused concern is the VIX index. Options traders are aware that a low VIX reading whilst the market is moving higher demonstrates complacency in the markets. Basically traders are losing sight of risk at current levels. The last low VIX reading which occurred earlier this year in April led to a decline of 9.7%. Coupled with the VIX reading we also see that the index has traced out a Five-Wave pattern. Markets often move in waves of threes and fives. The current pattern sports a Five-Wave scenario which may lead to a Three-Wave correction to the downside.
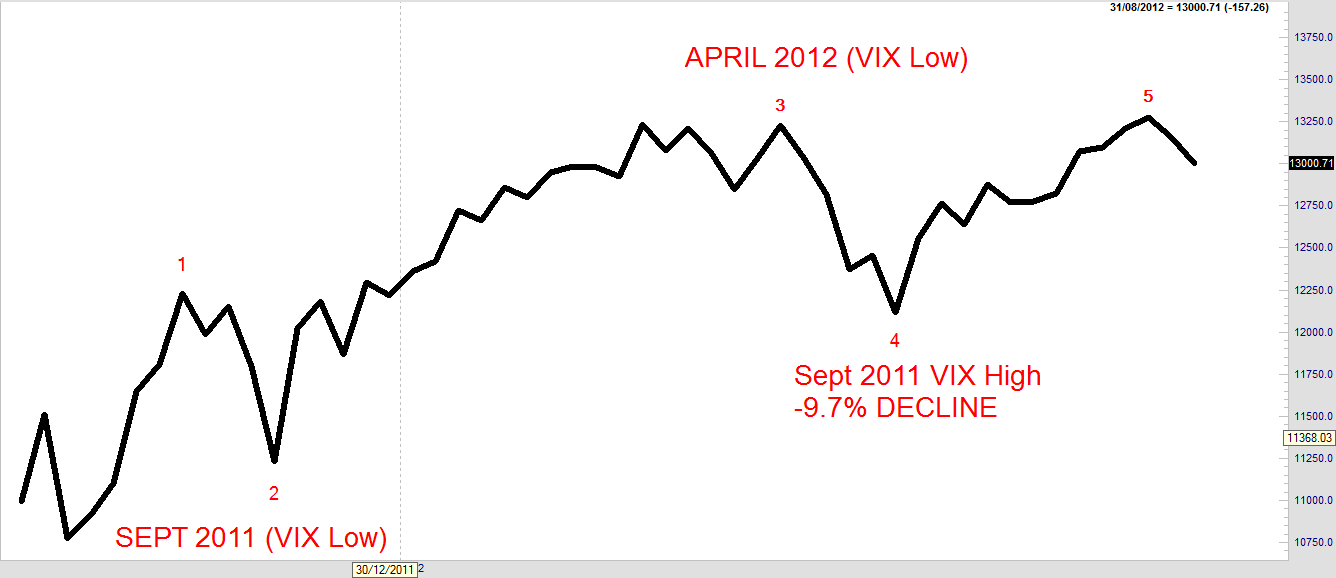
Five-Wave Pattern
We also have seen a Bearish Engulfing pattern emerge last week. This is where the index makes an attempt for a high but fails and closes the week lower. During the attempt to rally the market surpasses the previous weeks high and also breaks past the previous week’s low ending the week on a negative note.
Finally on a Momentum basis, the Dow Jones has provided a bearish signal suggesting that if today we see the index break below 12979 and fails to climb above 13101 then this could be the trigger to start a multi week decline.
Given the five important aspects above, next week may prove crucial along with Ben Bernanke’s speech today in providing an opportunity for the bears to come out from hibernation and lead the way forward for a market storm in September.
The bulls will need to take the index above 13317 in order to negate the above scenario.
