Silver s Golden Cross
Since 2007, there were six patterns of Golden and Death Crosses in silver. Each of the patterns successfully predicted declines and rallies respectively. We’ve heard […]
Since 2007, there were six patterns of Golden and Death Crosses in silver. Each of the patterns successfully predicted declines and rallies respectively. We’ve heard […]
Since 2007, there were six patterns of Golden and Death Crosses in silver. Each of the patterns successfully predicted declines and rallies respectively.
We’ve heard of golden and death crosses. Sometimes they work, sometimes they don’t. The trick is to examine the frequency as well as the track record of effectiveness in golden and death crosses.
When short-term moving averages cross above longer-term moving averages, the pattern is called a “Golden Cross” and usually anticipates higher prices. Conversely, when moving averages, cross below longer-term ones, the pattern is known as “Death Cross” and is usually indicative of falling prices to come. The key is to figure out, which moving averages to use.
In the case of silver, the 55-day moving average has just crossed above its 200-day moving average for the first time since October of last year.
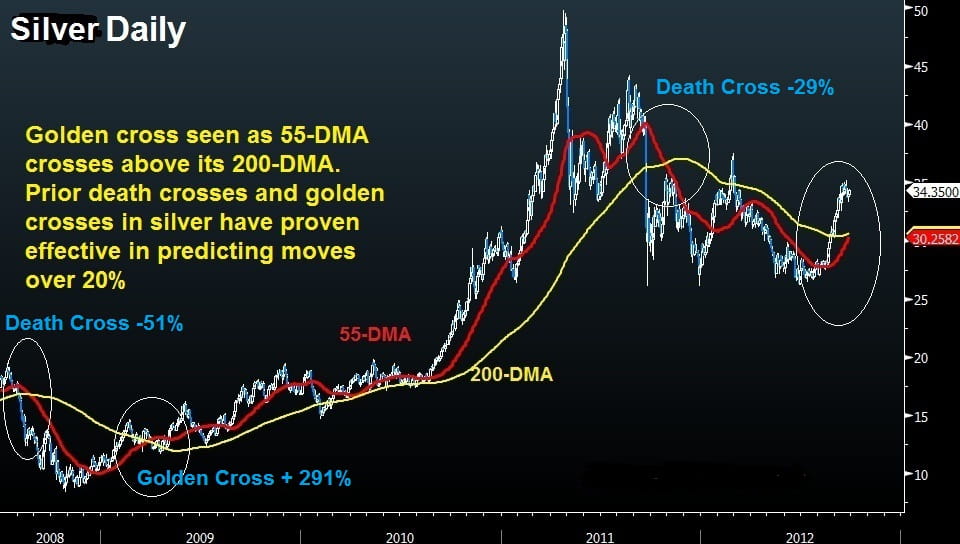
2 GOLDEN CROSSES SINCE 2007
November 2007, the Golden Cross led to a 61% increase over 5 months.
March 2009, the Golden Cross led to a 291% rise over 25 months.
3 DEATH CROSSES SINCE 2007
July 2007, Death Cross leading to a 17% decline over 1 month.
August 2008, Death Cross leading to a 51% decline in 2 months.
October 2011, Death Cross leading to a 29% decline in 2 months.
GOLD vs. SILVER
Compared to gold, silver seems to have more scope to regain its record high as the positioning in the metal among speculators has more upside. The number of silver futures net long contracts in the Commodity Exchange (Comex) stands at 34,000, nearly 120% below the record high reached in 2004. Meanwhile, net longs in gold are at 191,000, less than 30% below the 2009 high.
Among the reasons silver longs remain well below their record relative to those in gold is the 2011 collapse in silver, which resulted from a four-time increase in margin requirements by the Chicago Mercantile Exchange. The cost of trading silver jumped by more than 80%.
As central banks find original ways to monetize their nations’ debt– ECB vowing to purchase unlimited amounts of eurozone bonds in the event a nation requests assistance & the Fed buys bonds indefinitely (until unemployment becomes more subjectively acceptable)—the case for metals grows in appeal. And with it, global short term rates remain near zero.
Industrial demand for silver and its eroding supply relative to gold also supports its price. People may desire gold, but companies need silver. Year to date, silver is up 22%, compared to 13% for gold. The gold/silver ratio could show further declines from its 52.0 level. In 2010, the year of QE2, silver rallied nearly three times as much as gold. With gold/silver ratio expected to fall back towards low 40s and gold is seen regaining the 1850s, silver could well regain the 42.0-43.0 territory.
