Silver 8217 s Downward Spiral vs Gold
1 week to go into the end of H1 2013 and silver is down 35%, the worst 6-month performance by any commodity around. Gold is […]
1 week to go into the end of H1 2013 and silver is down 35%, the worst 6-month performance by any commodity around. Gold is […]
1 week to go into the end of H1 2013 and silver is down 35%, the worst 6-month performance by any commodity around. Gold is down 23%, copper is off 14%.
You’re probably familiar with the causes: falling inflation risks, weak global conditions and forced selling by hedge funds as well as futures traders in the Comex. The latter dynamic highlights the speculative drive against the metal, compared to copper or platinum. Recall how in spring 2011, US authorities quadrupled silver’s margin requirements to shed $20 off silver 31-year highs. It has now lost 60% of its value, trading below $20.00, the lowest level since September 2010.
Last week’s pronouncements from Fed Chairman Bernanke, suggesting Q4 as a likely start of the tapering of asset purchases ended all hope for any near-term recovery in metals. If the Fed does end up reducing asset purchases before year-end, then “disinflation” will gradually be replaced by “deflation” and mine closures will keep up with the number of commodity hedge funds closures
The latest action from China’s soaring money market rates resulting from dried up liquidity draws an ideal narrative for the proverbial 3rd shoe to drop in the global financial system (US fiscal cliff, European financial dislocations and China’s shadow financial system). Falling silver imports from the US, China and Japan have especially added to confidence among silver bears. The industrial component of silver demand may be here to stay as global growth shows no new signs of life beyond the US.
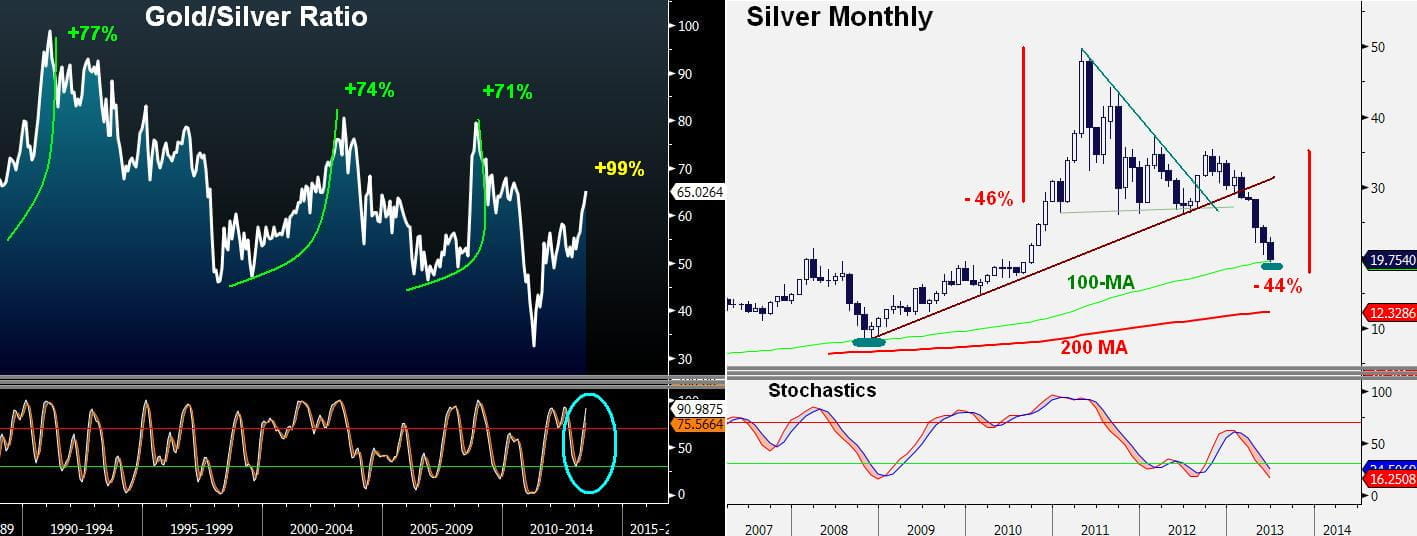
Following gold’s two failed rallies of 12% and 6% in April and May respectively, the next failure point is increasingly suggested to be near 1345-50. This may intensify silver damage, particularly as the Gold/Silver ratio has broken well above its usual +73% rising cycles (see past 20 years in chart) to chart a 99% rally from its 2011 lows.
Does all of this imply that silver’s super rally is over? Yes.
But silver’s two possible sources of technical saving grace are: (i) the 100-month moving average, drifting at 19.45. This may suggest some price stabilization following a 5-month losing run (longest since 1995); (ii) the 44%decline from the October high is nearing the 46% decline from the 2011 peak to the Sep 2011 low. At the current juncture, silver’s technicals point to capping the next attempts at recovery, ranging from 21-23, to re-trigger 19.60-19.70.