


July 21, 2021 11:24 AM
Should traders be looking at yields to help trade Yen?
US 10-Year yields traded to their lowest levels since February yesterday, reaching a low of 1.129 before reversing and closing the day positive, at 1.223. The price action left a long lower shadow on the daily candlestick and a small read body. This is known as a hammer, in which prices “hammer” out a bottom. (Ideally a hammer should have a shadow 2-3 times the length of the real body.) Yesterday, yields closed back above horizontal support at 1.223 and if they close today above 1.227, they will have created a false breakdown below the 38.2% Fibonacci retracement level from the March 2020 lows to the March 30th, 2021 highs. Also notice that as yields put in a lower low, the RSI did not, and indication of a possible reversal.
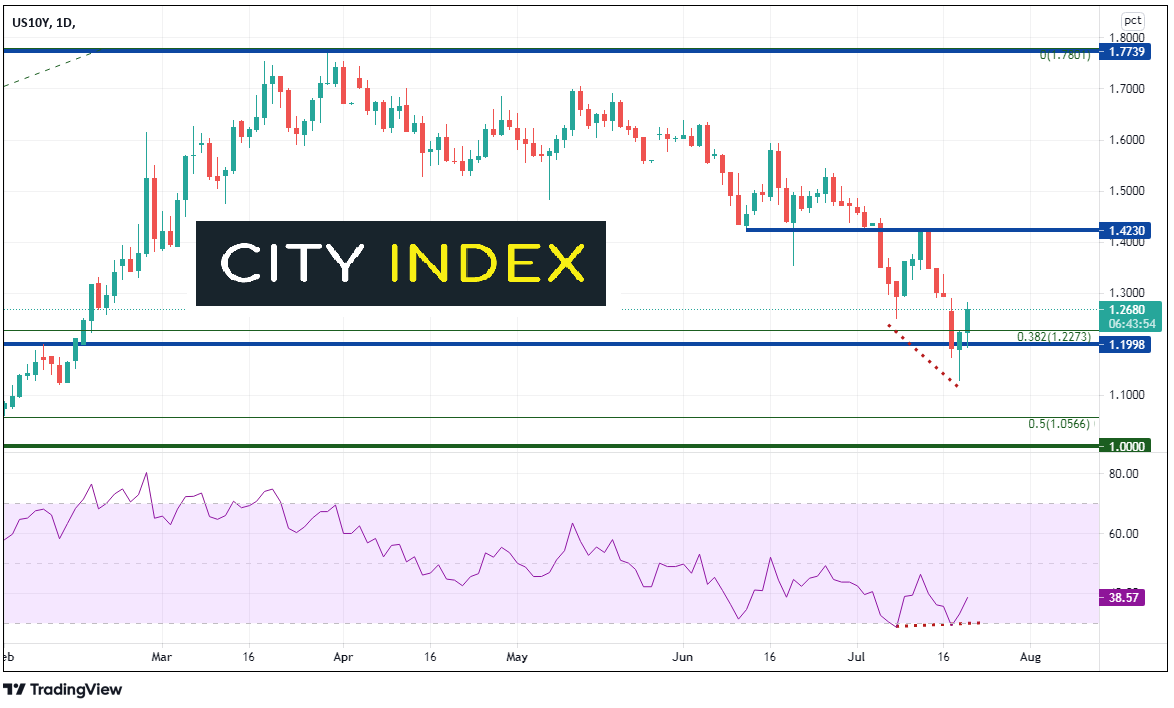
Source: Tradingview, City Index
Japanese candlestick cheatsheet
US 10-Year yields and XXX/JPY pairs typically trade together. The correlation coefficient at the bottom the USD/JPY chart below shows that since early January, with the exception of June, the 2 assets have been positively correlated. Any reading about 0.00 is a positive correlation and any reading below 0.00 is a negative correlation. The closer the reading is to +1.00 (-1.00), the more the 2 assets are positively (negatively) correlated. Traders should pay attention to readings above +0.80 or below -0.80 to look for strong correlations. The current correlation coefficient between 10 Year Yields and USD/JPY is +0.81. Therefore, as long as the correlation holds, yields and USD/JPY should be moving in the same direction. Strong resistance in USD/JPY is near 111.00, which is the confluence of the previously broken trendline and horizontal resistance.
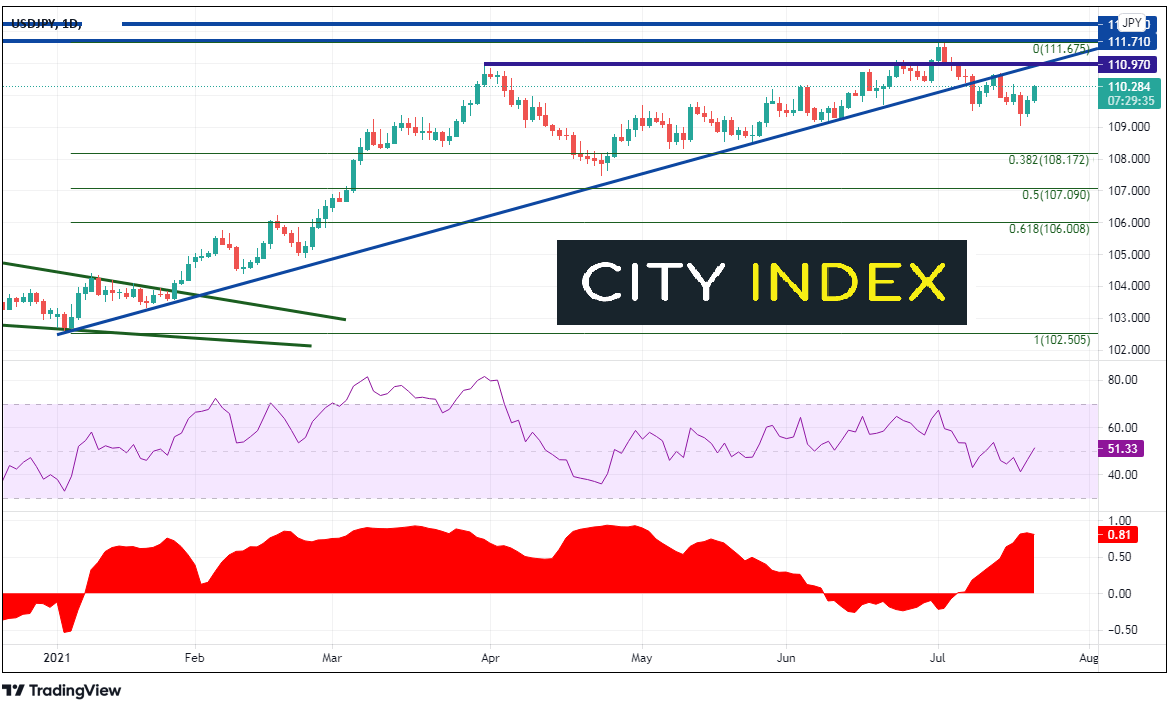
Source: Tradingview, City Index
Correlation coefficients for 10-year yields and cross currency Yen pairs are even stronger on the daily timeframe. For AUD/JPY, the correlation coefficient is +0.94! Notice that similar trading pattern this week between US 10-year yields and AUD/JPY:
- A large down day on Monday
- A hammer on Tuesday (held horizontal support)
- A reversal thus far today, back about the 38.2% Fib retracement level
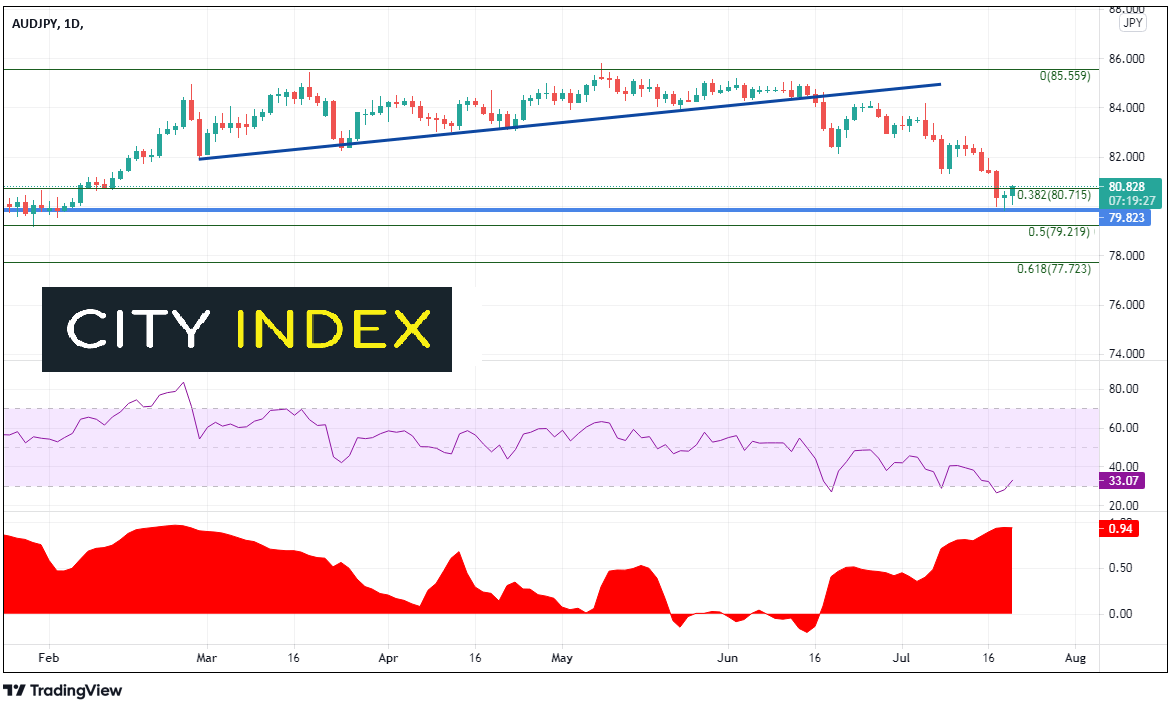
Source: Tradingview, City Index
The correlation coefficients between US 10-year yields and other Yen pairs are similar:
- EUR/JPY: +0.95
- CAD/JPY: +0.94
- GBP/JPY: +0.92
- NZD/JPY: 0.85
- CHF/JPY: +0.82
If traders are looking to trade Yen pairs and are looking for more information to help them decide, they should look at the US 10-year year for help in determining direction!
Latest market news
Today 08:18 AM
Yesterday 10:40 PM
Latest Forex articles


Yesterday 11:30 AM
Yesterday 03:42 AM