Shift in Euro Cycle
We examine the 200-month (not day or week) moving average on the most heavily-traded currency pair in the +$5 trillion/day FX market. The picture speaks […]
We examine the 200-month (not day or week) moving average on the most heavily-traded currency pair in the +$5 trillion/day FX market. The picture speaks […]
We examine the 200-month (not day or week) moving average on the most heavily-traded currency pair in the +$5 trillion/day FX market.
The picture speaks a thousand words.
200-month averages can be powerful when they are consistent with cycle turnarounds.
Over the last nine years, EUR/USD consistently held above its 200-MMA.
Since 2003, EUR/USD tested (without breaking) its 200-MMA in three occasions (Nov/Dec 2005, June 2010 and August 2012)
- Nov/Dec 2005: ECB began its three-year tightening campaign. Six months later, the Fed halted its tightening.
- June 2010: Euro bottom coincided with chatter of QE2 by the Fed, chatter of Beijing’s purchasing eurozone bonds and stabilization of Spanish unemployment.
- August 2012: Euro bottoms on ECB verbal/operational support for eurozone & Fed’s QE3.
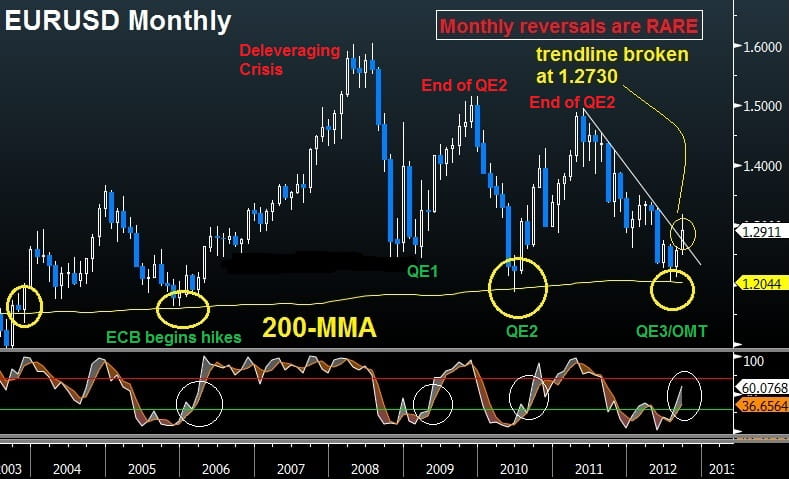
EUR/USD shows a rare monthly reversal of a 16-month downtrend. In order for the reversal to be confirmed, we must see a Friday close (month-end) above 1.2730-50, which can mark the start of +7% appreciation nearing $1.35 by mid Q4.
We spoke in length about the fundamental catalysts for a euro trunround over the past two weeks. Fundamental factors can be powerful in explaining money flows, but not always effective in timing. Combining the array of technical indicators with the ECB’s conditional policy stimulus and the Fed’s open-ended balance sheet expansion paves the way for the next $1.35-bound move.
