Shell profit surprises whilst BP rekindles doubts
Shell’s surprise rise in headline quarterly profits is rightly impressing shareholders, whilst rival BP still has work to do.
Shell’s surprise rise in headline quarterly profits is rightly impressing shareholders, whilst rival BP still has work to do.
Although the result is fairly noisy and even a little foggy (note the group excludes “identified items”) it’s still clear the benefit from rising BG volumes is kicking in, whilst a more adroit recalibration of expenses is also showing too.
On a related note, ‘forward guidance’ on capex plans continues, as the group continues its rolling programme of reducing the gradient of future capex, this time to the lower end of the prior range in 2017 (c. $25bn).
Maybe the quarter was a fortunate one for production write-off costs, which could pick up in H1.
In the near future investors might judge the group’s positive ‘exit’ activities—its disposal programme—more harshly. There’s a built in contradiction in Shell trying to sell $30bn in non-core assets into a low oil-price environment.
There’s ample room for the group to trip up on further bumps in the road, particularly on dividends.
Shell is currently sporting what could be best described as a ‘technically covered’ dividend, rather than a ‘technically uncovered’ one and it’s difficult to see how the group can avoid dipping into borrowings to temporarily maintain coverage at some point during the next 18 months.
But no one thinks a Shell pay-out crisis is brewing.
It still looks to have played its own particular hand better than many oil majors in the quarter, and CEO van Beurden’s “Dividend Statement” succeeded in avoiding all sensitive eggshells for now as well.
For BP, the £728m one-off accounting gain which flattered the upstream outcome, and downstream underlying pre-tax profit decline of 39% y/y to £1.4bn, make the verdict on its figures poorer than many City of expectations.
BP has, however, continued to demonstrate resilient cash-generative strength during the quarter which does not look fully priced into its stock, although to be sure, to an extent the discount is linked to low oil prices.
Still, BP’s long-term coverage profile easily looks more assured than its FTSE rival, with a range of 1.4-1.6 times not seen as a particularly punchy call in the City for the next three years.
BP stating that it remains on track to achieve organic free cash flow (net of Gulf of Mexico payments) with oil at $50bbl-$55bbl might be the strongest positive takeaway from its Q3 figures.
Shareholders however are judging BP based on recent performance against other super majors and have found the group wanting.
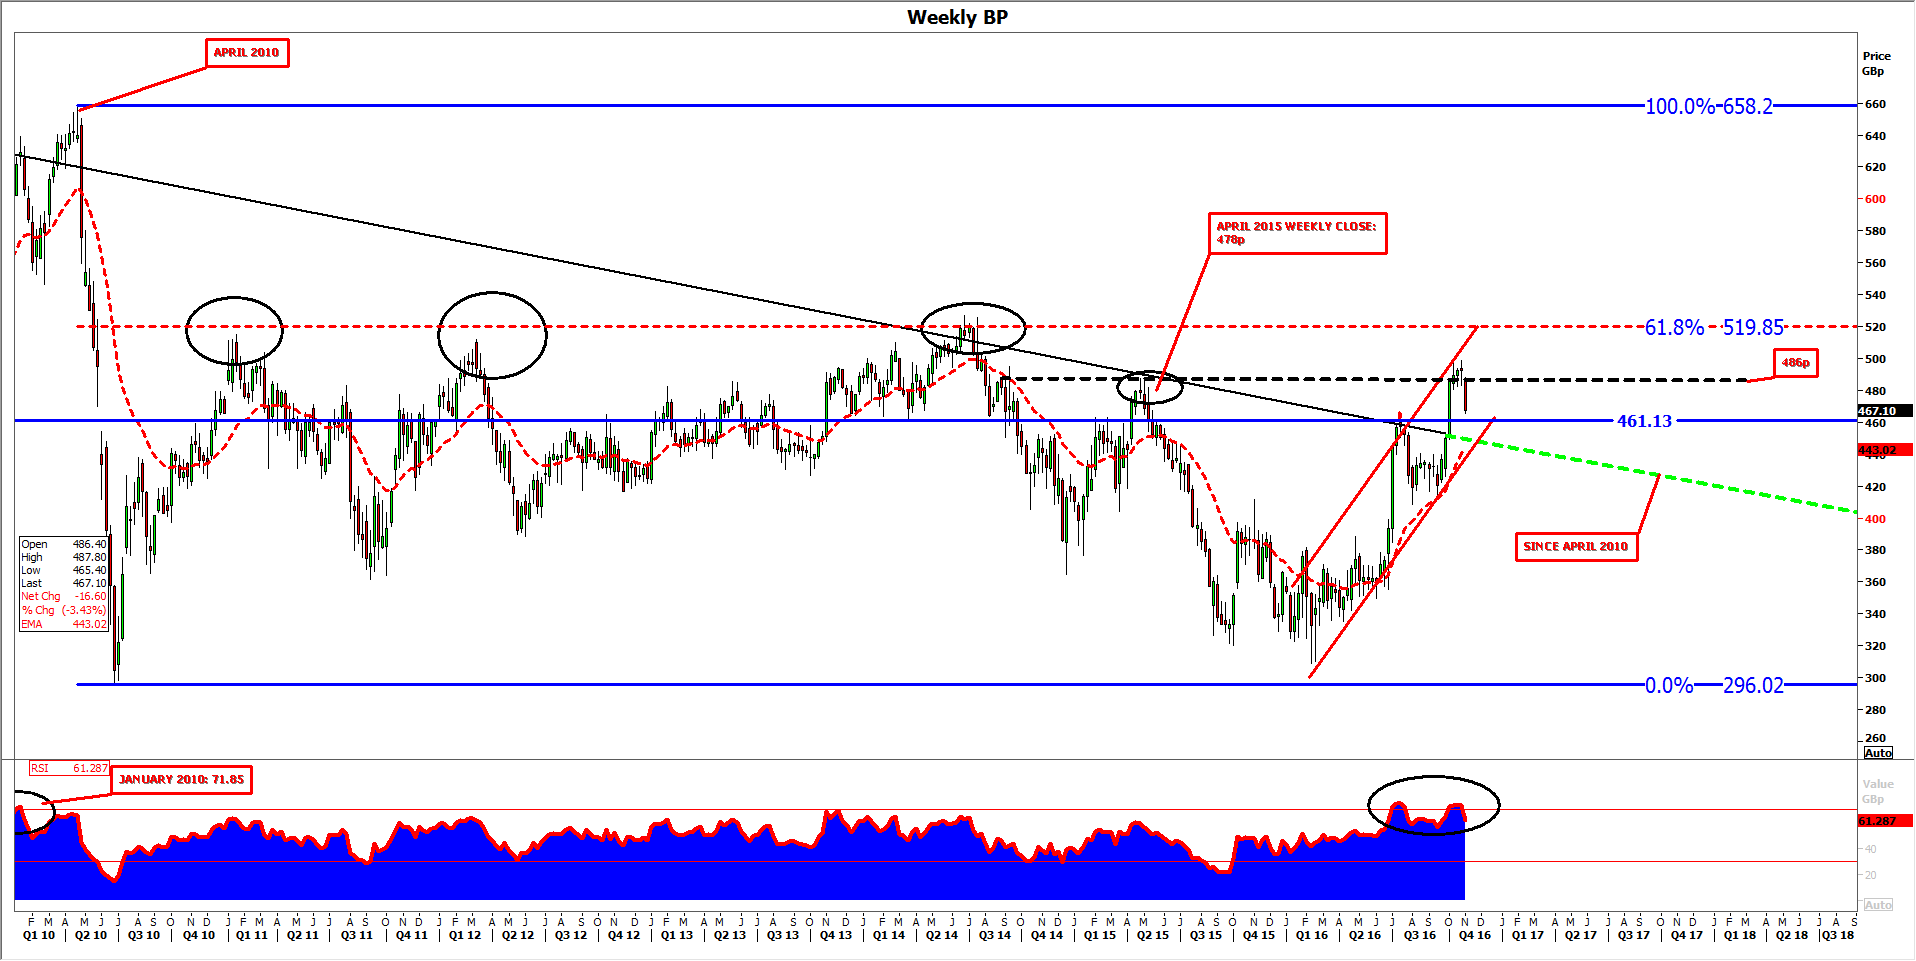
Please click image to enlarge
