


Top mega-major’s price return this year could be most minor among peers
Shell posts some of the most disappointing quarterly figures from a supermajor due to its outsize link to the over-supplied gas market. Its shares are slumping more than most rivals did after their results in recent days. The stock has been pinned lower for the whole session and was last down 5.7%, its worst one-day drop since October.
LNG prices during the quarter were about 40% lower than in the year before. Given that they prices have continued to fall, taking the cost of the fuel in Asia the lowest in a decade, Shell's outlook for the current quarter is also challenged.
- Adjusted net income was $3.46bn down 26% from a year earlier, missing the low end of forecasts and the biggest miss since 2016
- Cash flow from operations—closely watched by analysts—still rose 16% from a year earlier to $11.03bn. However it was flattered by a $600m working capital movement
CEO Ben van Beurden has maintained 2019 guidance in light of the earnings and declared the group on track to achieve a 2020 organic free cash flow goal of $25bn-$30bn, enabling $25bn in buybacks. Yet with the dividend in the quarter and buybacks of $3.8bn and $2.1bn respectively not covered from cash, investor concern is rising, if not yet at anxiety levels. From a peak that was 13.5% higher for the year in June, RDSA’s 7% slide since, including Thursday, trims price return even more. Investors can be expected to hold off further in the second half. Though fellow ‘mega-majors’ Exxon, Chevron, BP and Total are also turning lower for the year, Shell looks likely to underperform.
Chart thoughts
RDSA continues to hug the topside of its secular uptrend from the bottom of the crude oil price slump in December 2015. It is also just a moderate amount, around 10%, below 1st May’s cycle high. So there’s little sense of alarm here. There’s no mistaking the end-of-phase feel of right now though. The pristine May-to-July rising line has been obliterated by Thursday’s slump. 14-day Relative Strength Index is also plummeting. Support is visible at the zone of consolidation that may have a ceiling at the 23rd May close. (See candle in red ellipse). That would be invalidated if price pierces the bottom of the range, codified as the 8th May close of 2376p. That price is significant as it marked the beginning of 10 successively higher daily highs. A close above the 61.8% marker referencing the May-July move now seems unfeasible. Together with Thursday’s gap and fierce sell-off, deep follow-through looks likely. If seen, that would bring in May’s 2368p on 7th May as the next downside target.
Royal Dutch Shell CFD – daily
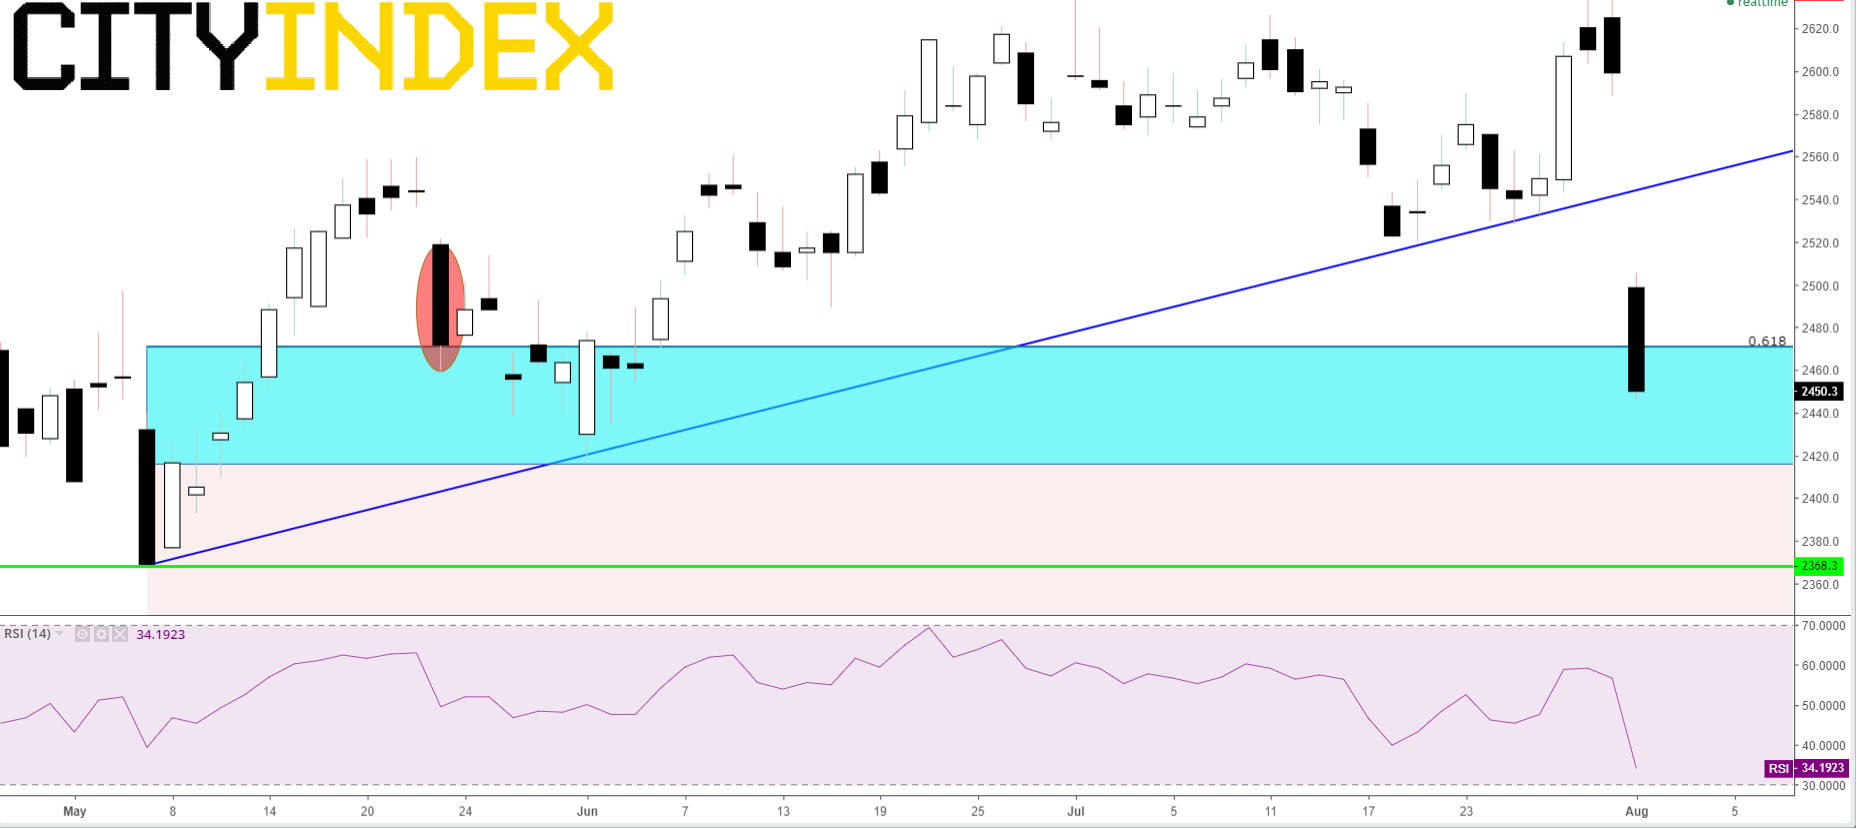
Source: City Index
Latest market news
Latest Oil articles


Yesterday 08:33 AM
April 17, 2024 11:16 PM