


March 10, 2021 10:21 AM
Shady US CPI data; 10 Year Auction and ECB ahead
The highly anticipated CPI data for February was released earlier today, and the core data was slightly worse than expected. The headline CPI print for the more closely watched YoY rate was in line at 1.7% vs 1.4% in January. However, the Fed is more concerned about the core Inflation Rate, which excludes the more volatile food and energy prices. The core inflation rate YoY down ticked from 1.4% in January to 1.3% in February, vs a 1.4% expectation. Curious as to how the core rate could be lower with higher energy prices and higher food prices? The BLS said that “data collection in February was affected by temporary closing of limited operation of certain types of establishments”. In other words, the data is kind of spotty and shouldn’t be relied on.
Today, the US Treasury will auction off $58 billion of 10-year notes. Results will be made available shortly after 1:00pm ET. Yesterday’s 3-year note auction was strong. However, the longer-term duration auctions will be more closely monitored. (Tomorrow is a 30-year auction.). Recall on February 25th the 7-year auction that was extremely weak. This sent yields higher, primarily in the belly of the curve. 10-year yields shot up to 1.6%, and worried stock investors. Yields, bid-to cover ratio, and the number of indirect buyers should be monitored to determine whether the auction was successful. After the weak 7-year auction, bonds and stocks continued lower while yields and the US Dollar moved higher.
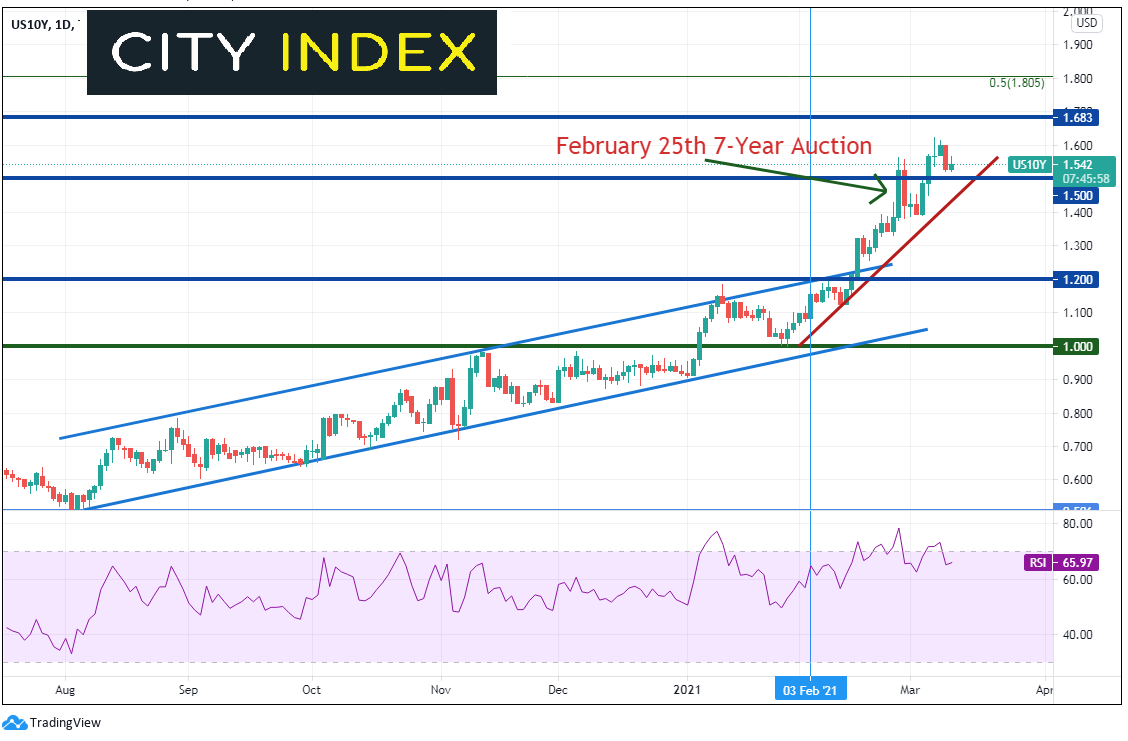
Source: Tradingview, City Index
After the weaker Core CPI data, which implies the Fed will keep its unprecedented QE for longer (as Fed members have been saying), the US Dollar Index (DXY) sold off and stocks went bid. This can be seen in the price action of EUR/USD, which is highly inversely correlated with the US Dollar Index. (EUR/USD was also our Currency Pair of the Week). The current correlation coefficient is -0.87 on a 240-minute timeframe. For reference, a reading of -1.00 means that the 2 assets are perfectly negatively correlated. After completing an AB=CD price pattern, EUR/USD moved higher and is approaching horizontal resistance near 1.1950, which dates to the lows of February 5th. Above there is the 38.2% Fibonacci retracement from the February 25th highs to the March 8th lows near 1.1990, which also confluences with horizontal resistance. Support is at the March 8th lows near 1.1835.
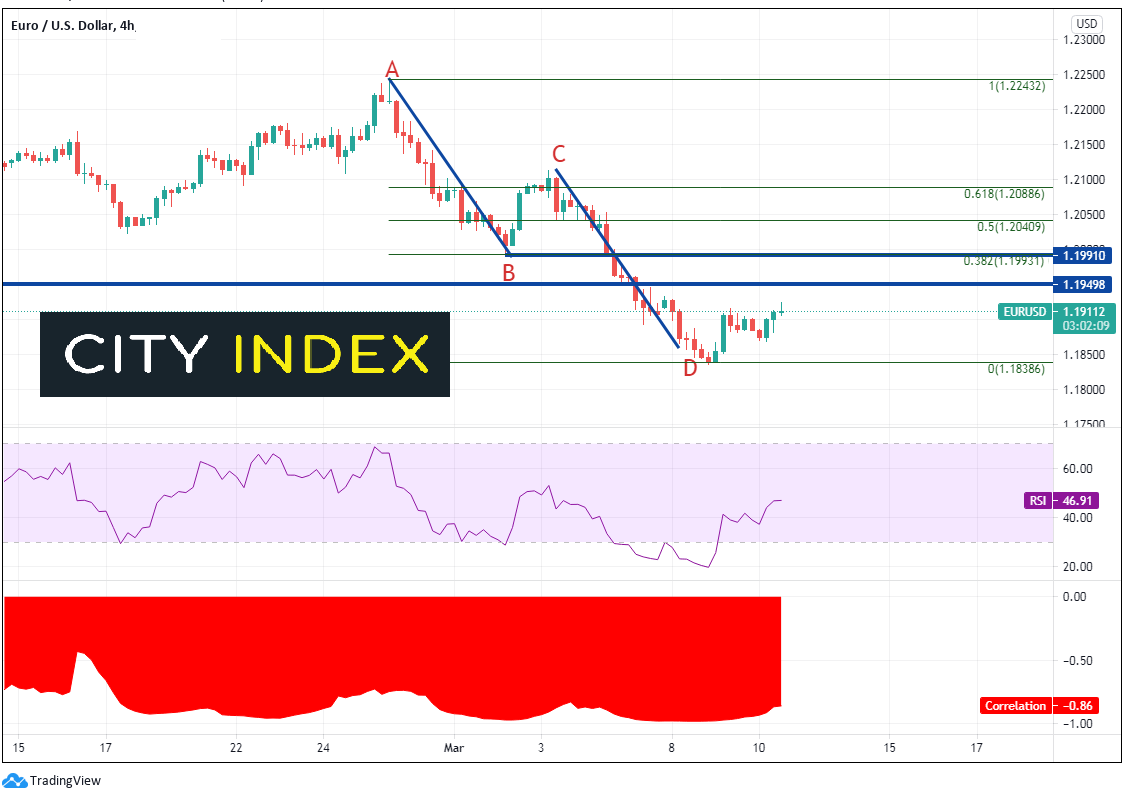
Source: Tradingview, City Index
Remember that the ECB meeting is tomorrow. See our ECB Preview here. With the US auctions today and the ECB meeting tomorrow, price in both the DXY and EUR/USD can move in a hurry.
Learn more about forex trading opportunities.
Latest market news
Yesterday 08:33 AM
Latest EUR articles
April 13, 2024 08:00 PM
March 25, 2024 02:55 AM
January 22, 2024 04:19 AM
January 18, 2024 04:46 AM