Sainsbury’s has managed to round off its most abysmal year for a decade with no additional nasty surprises.
Britain’s No.2 supermarket still went significantly into the red—reporting its first annual loss since 2005—even using the less demanding ‘underlying’ reporting basis UK supermarkets have opted for in these straitened times.
And including a net total effect from written-off store property, and new stores that were in development before last year’s perfect storm hit, Sainsbury’s would have booked an actual loss of £825m, not the fairly contained £72m.
An additional plus, for Sainsbury’s versus its peers, is that it has kept to plan by keeping up some sort of dividend growth together with a clearly communicated policy.
This is why the stock received a fillip at the open.
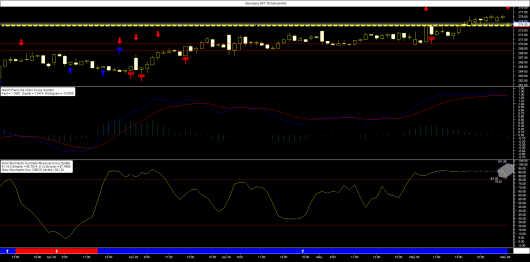
However, both the underlying stock and the Daily Funded Trade (DFT) in Sainsbury’s offered by City Index are showing visible signs of exhaustion.
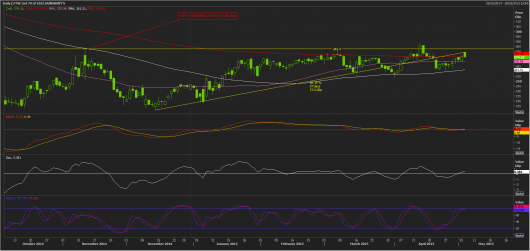
The stock gained about 26% since December.
That’s no mean feat if you consider Sainsbury’s shares are the last among shares of the UK’s Big 3 supermarket chains to retake and sustainably trade above its 200-day moving average—an important test of strength for traders.
Sainsbury’s shares definitively fell below the boundary in December 2013 and have scarcely managed to get and stay above it since.
Should the stock slip below the MA, which is currently around 274p, again, in the near term, it risks a fall back to support around 260-255p.
It looks like a sell signal from the Slow Stochastic Reversal System attached to the DFT chart is imminent.
We see the 274p is highlighted here too, with more forgiving important supports in this time frame (half-hourly) than in the underlying.