S amp P500 Trend amp Breadth Analysis
93% of shares in the S&P500 index are trading above their 200-day moving averages a level not seen since May 2011. The indicator (200-DMA participation) […]
93% of shares in the S&P500 index are trading above their 200-day moving averages a level not seen since May 2011. The indicator (200-DMA participation) […]
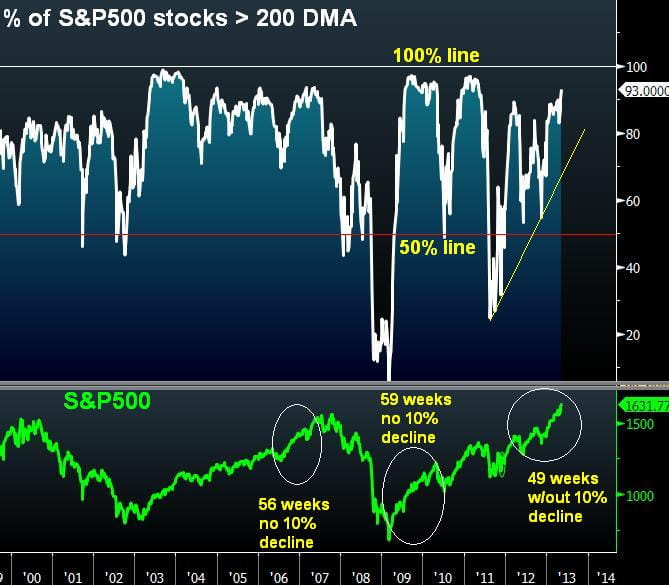
93% of shares in the S&P500 index are trading above their 200-day moving averages a level not seen since May 2011. The indicator (200-DMA participation) sheds light on any unfolding divergence between the price of the index and the number of individual components. That is especially the case if the breadth line stands near or below 50% during a continued increase in the underlying market.
17 quarters vs 19 quarters
The continuity of the recent rally is becoming hard to ignore. The S&P500 has not had a 10% peak-to-trough decline in 49 weeks. Prior rallies without a 10% decline were seen in Mar 2009- Apr 2010 (59 weeks) and June 2006 to July 2007 (56 weeks).
Another fact worth noting is that the rally since the March 2009 lows has lasted for 17 quarters, nearly matching the 18 quarters from autumn 2002 to autumn 2007.
Exceeding the Trend
The S&P500’s ascent can also be measured by the extent to which it has surpassed from long term measures of trend. Currently trading at 1633, the S&P500 is 11% above its 200-DMA, the farthest away the 15% deviation attained in February 2011
On a weekly basis, the S&P500 is 22.5% above 200-WMA, the farthest it had been since 2000, when the index rose as high as 31% above its 200-DMA at the heights of March 2000. Even during the record levels of October 2007, the S&P500 went as far as 19% above its 200 WMA.
On a monthly basis, S&P500 stands 24% and 27% above its 100 and 200-month average respectively, the farthest away from its long term average during the post financial crisis. The last time we saw bigger disparities was in 2007.
Health & Financials
Year-to-date, the best 4 sectors have been health care (+21.3%), consumer discretionary (19.3%), consumer staples (+18.0%) and financials (+17.5%). Materials and technology have lagged at 6.6% and 7.9% respectively.
Over the last 4 weeks, the sectoral returns have been led by financials, technology, consumer discretionary and materials, with utilities being the only losing sector.
Entering its 7th monthly consecutive rally, the S&P500 attains its longest monthly gain since 2006-2007. As lofty as the current levels appear, long term momentum indicators continue to point to neutral-to-positive dynamics, last seen in 2004, which was the 2nd third of the 2002-2007 bull market. As support levels rise to 1580, key upside target emerges at 1687 as the next viable barrier.