S amp P US stocks rally losing steam
After opening in the positive territory, the US equity markets have now turned slightly lower as the Street awaits Apple’s much-anticipated event and the potential […]
After opening in the positive territory, the US equity markets have now turned slightly lower as the Street awaits Apple’s much-anticipated event and the potential […]
After opening in the positive territory, the US equity markets have now turned slightly lower as the Street awaits Apple’s much-anticipated event and the potential impact that might have on the stock price. Although the broader US markets could still turn bullish during the late US trading session, equities are falling out of favour for the time being. Speculators are probably still wondering what really caused this week’s sharp rally and are thus exercising some caution. Was it the slightly better-than-expected Chinese exports figure that led to calls that the markets had over-reacted to the Chinese slowdown story? Or was it perhaps hopes about further PBOC intervention? Whatever the reason, the markets displayed a big sigh of relief, leading to a sharp rally this week. But after three consecutive up days, today’s renewed selling pressure should not come as a major surprise. After all, the Chinese trade figures were still very weak while there is great uncertainty about growth elsewhere across the globe and the timing of US interest rate rises.
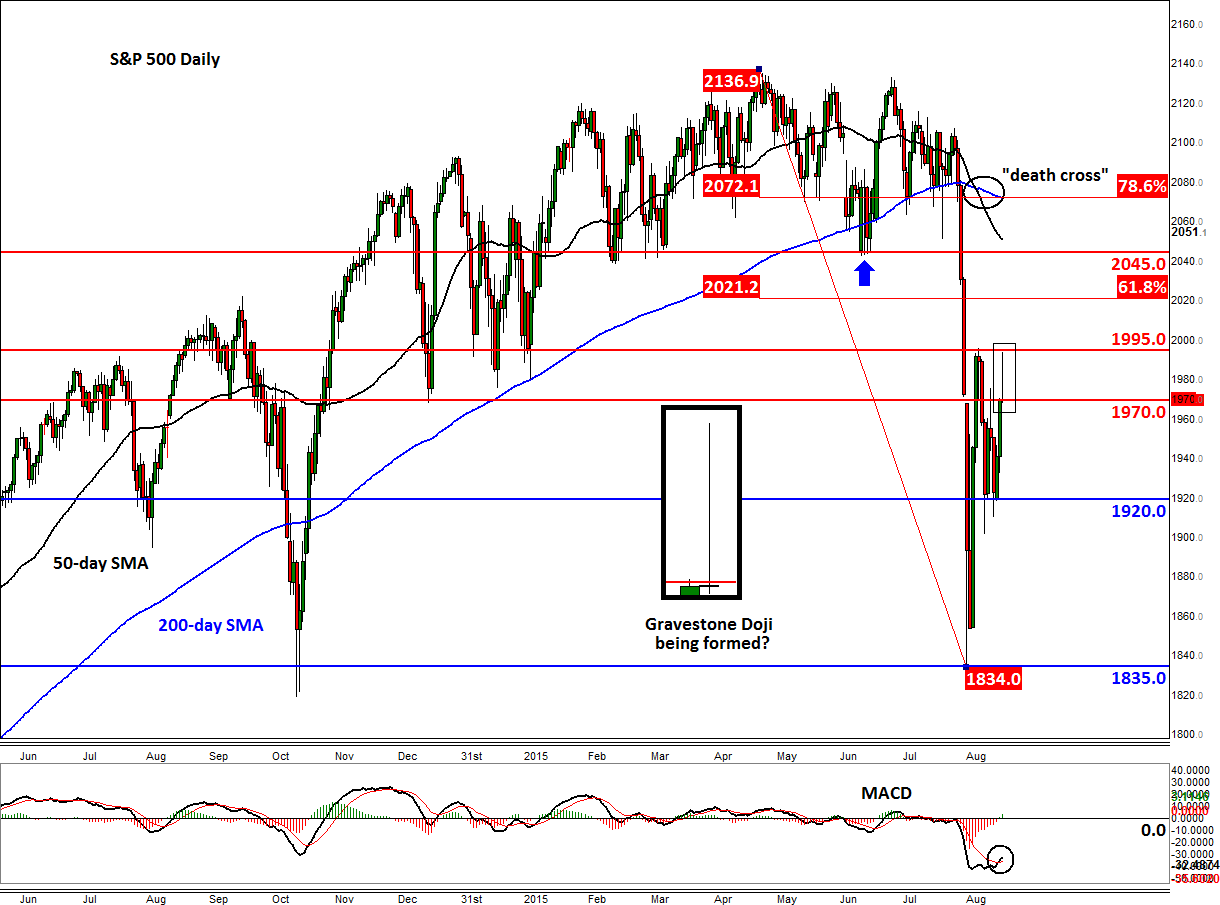
Meanwhile from a technical point of view, the S&P desperately needs to see the return of the buyers ahead of today’s close; otherwise, the index could be in for some follow-up technical selling over the next several days. That’s because the S&P is currently displaying a so-called “Gravestone Doji” candlestick on its daily chart, which is a bearish technical pattern. This particular candlestick is formed when the open, low, and close are roughly the same level and there is a long upper shadow or wick. But as the session has not ended yet, there’s plenty of time for the S&P to potentially bounce back, especially since it is currently trading around 1970, a level which was previously resistance and may now turn into support. But if the S&P closes at or below 1970 then a sharp sell-off could be the outcome for Thursday and potentially beyond.
The next key support to watch is at around 1920 and this level could well be the initial big target for the bears should the selling pressure continue from the current levels. A potential closing break below 1920 in the upcoming days would be a very bearish development, as it would confirm the trend of lower lows and lower highs.
But as mentioned, it is possible that the bulls may be able to defend their ground here. The sharp rebound in recent days may have given investors renewed hopes that a more significant rally could be on the way. If the bulls manage to defend 1970, they will then need to take out the next key resistance level at 1995 before we can see more technical buying. Even so, it is still pretty much likely that the bullish trend would come to a halt around another, more significant, resistance level such as the 61.8% Fibonacci retracement at 2021, prior key support (now broken) at 2045 or the 200-day moving average at 2072. The sudden sharp sell-off that occurred towards the end of last month has probably changed traders’ expectations. Rather than buying the dips, they may now be looking for opportunities to sell the rallies.
Taking everything into account, speculators should continue to monitor price action closely as the technical outlook for the S&P and other major global indices are still not decisively favourable for the bulls. The bears meanwhile will need to be extra patient and wait for confirmation following the recent bullish price action. Will they get their confirmation by the close of play today? Time will tell.