S amp P 500 testing key resistance
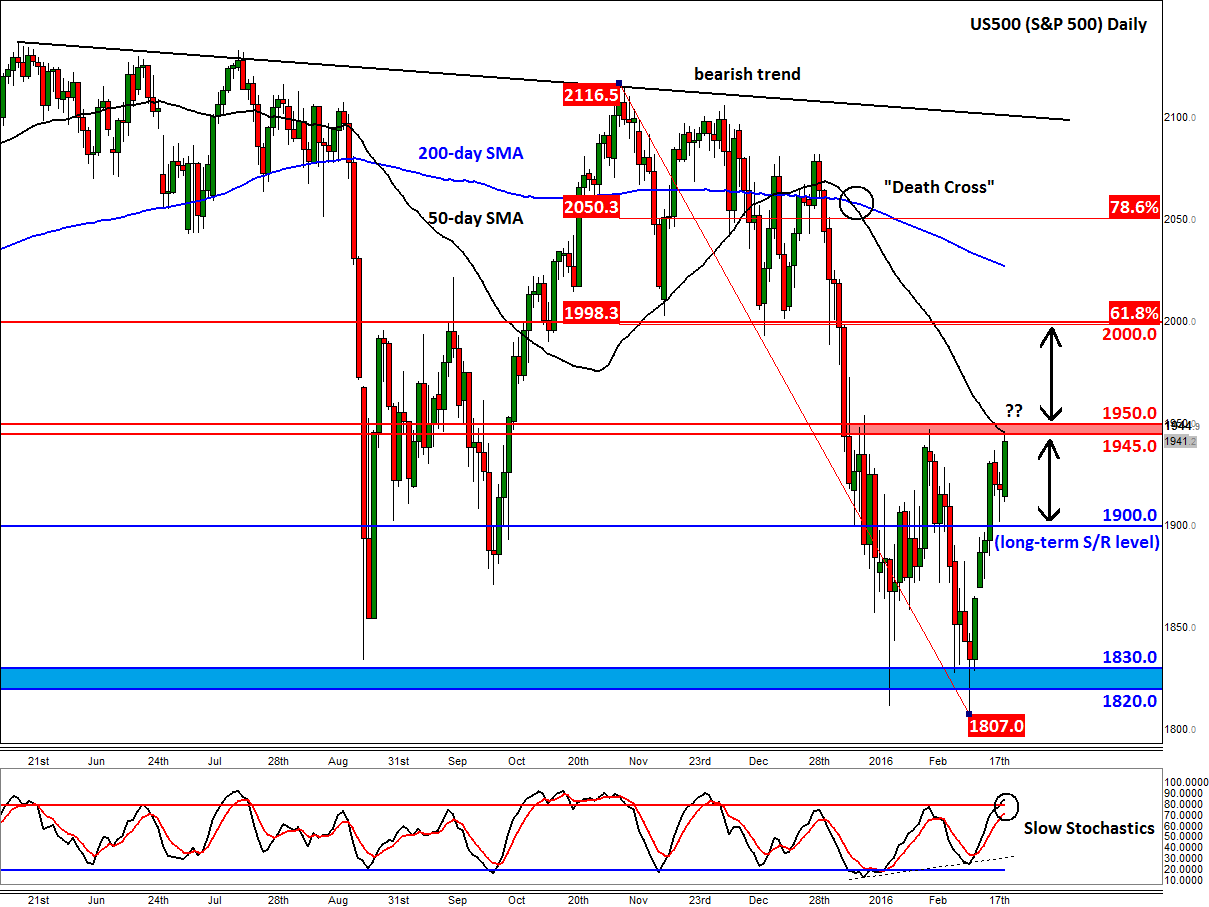
Last week, we took a look at the weekly chart of the S&P 500 and mentioned two very important support and resistance ranges: 1800-1830 on […]
Last week, we took a look at the weekly chart of the S&P 500 and mentioned two very important support and resistance ranges: 1800-1830 on […]
Last week, we took a look at the weekly chart of the S&P 500 and mentioned two very important support and resistance ranges: 1800-1830 on the downside and 1933-1950 on the upside. We said that while a breakout is a possibility, so too is range-bound price action within these large ranges and whatever the outcome, there should be plenty of trading opportunities to look forward to.
Today, we are taking a closer look at the technicals on the smaller daily time frame and we can refine our levels even more precisely. On this time frame, it is actually clear that the potential resistance is in the 1945-1950 range (as opposed to 1933-1950 on the weekly), an area which has been tested already today.
As well as the top of the recent range, the 50-day moving average also comes into play around this 1945-50 range. The last time the index tested this particular moving average was at the end of last year, which preceded that big drop. Since then, the 50- has moved below the 200-day average to create a so-called “death crossover.” When the averages are in this particular order, some trend followers tend to sell on rallies rather than buy the dips. That being said, some of the shorter-term and fast-moving exponential moving averages are now pointing higher because of the size of the rebound and also the amount of time the index has spent above the recent range lows. So, some of the bearish characterises that were relevant previously are now less relevant.
Nevertheless, with the S&P 500 testing the top its recent range and also the 50-day moving average, there is a possibility for at least a short-term pullback here, especially given the fact that the momentum indicator slow stochastics has also reached the ‘overbought’ threshold. If the index does retreat from here, the next stop could be the long-term pivotal level of 1900. Short-term speculators may also want to plot the Fibonacci retracement levels from the bounce at 1807 in order to see where some of the “invisible” levels of potential support reside. In any case, a move back below 1900 would be deemed a bearish outcome.
The bulls meanwhile would want to see a clean break above the 1945-1950 range. They are no doubt encouraged by the manner in which the market has rallied in recent times – with small pullbacks – and the fact that the key 1800-1830 support area has held firm several times now. It is also important to highlight a potentially significant reversal signal that may have occurred earlier in the month: a false break below the prior lows, confirmed by the momentum indicators making higher lows. But at this stage, this must only be treated as a potential, rather than actual, reversal signal for the reasons stated above.
In summary, there is a possibility for a move to the downside now that the S&P 500 has reached a potential resistance area around 1945-1950. However, if this area breaks down then there is just thin air until the next key resistance zone around 2000-2010 (this is where previous support meets the 61.8% Fibonacci retracement level), potentially leading to a sharp rally.