US stocks are trading sharply higher today, tracking the massive gains seen across the European markets after the ECB President Mario Draghi delivered a surprisingly dovish message at the much-anticipated press conference earlier today. Without going too much into any technical details, the long and short of it is that the ECB’s bond buying stimulus package could be beefed up as early as the Bank’s December meeting, while interest rates could also be cut to negative. Unsurprisingly, the euro has tanked today, while the higher-yielding currencies and stocks have rallied across the board.
In the US meanwhile, the weekly jobless claims fell to 259,000, which means they remained not very far from the low levels of 1970s. On this occasion however, good news was not bad for US stock markets, partly because of the impact of the ECB’s extremely dovish message. The focus of investors will now turn to earnings from tech giants Amazon, Google and Microsoft. Their results will come in after the official close of the stock markets, so we could see some further volatility in US index futures later on. This earnings season has not been great one so far, but not as bad as had been feared by many either. So any positive surprises here should give the bulls confidence to further expand their positions.
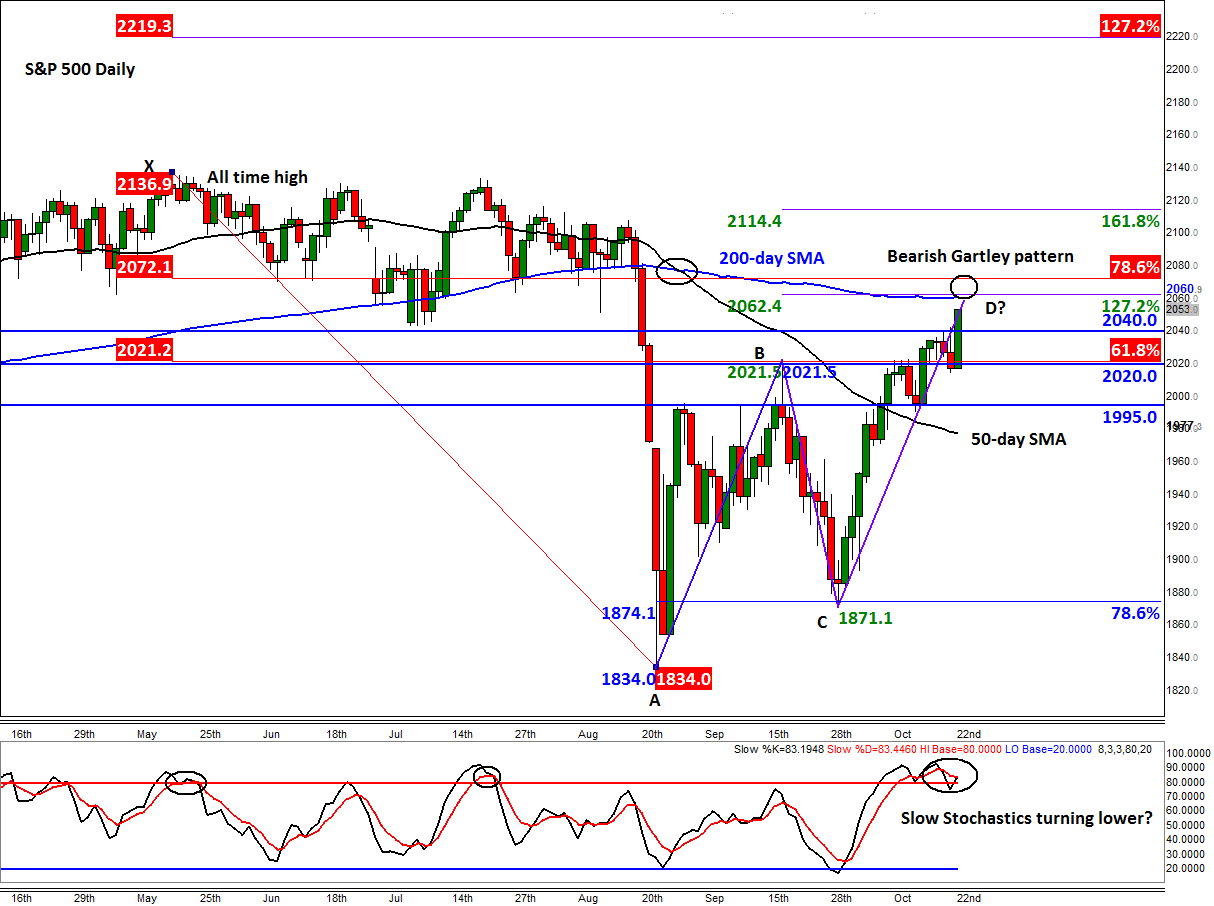
That being said, the S&P is now approaching a major area of resistance around 2060 to 2072, so further sharp gains may be difficult to achieve until and unless the bulls reclaim this area. This is where a Bearish Gartley comes into play – this pattern being derived from the convergence of some key Fibonacci levels and an AB=CD move. As shown on the chart, the 78.6% Fibonacci retracement level of the move lower from the record high (i.e. the XA swing) meets the 127.2% extension of the last notable downswing from point B to C in a close-enough proximity. In addition, the point D of the AB=CD pattern and the 200-day moving average also reside within this 2060 to 2072 range, making it a critically-important technical area.
In other words, if the stock markets have already peaked, they ‘should’ turn lower from around these levels. This also means that if the sellers fail to show up here in a meaningful way, then the S&P could easily re-test and potentially surpass its previous record high and thus maintain its long-term bullish trend for yet another year.