S amp P 500 supported after China rebound
S&P 500 (daily chart shown below) futures rose sharply in pre-market trading on Thursday after the Asian session showed a broad-based rally following Wednesday’s plunge. […]
S&P 500 (daily chart shown below) futures rose sharply in pre-market trading on Thursday after the Asian session showed a broad-based rally following Wednesday’s plunge. […]
S&P 500 (daily chart shown below) futures rose sharply in pre-market trading on Thursday after the Asian session showed a broad-based rally following Wednesday’s plunge. The Shanghai Composite closed up nearly 5.8%, showing its greatest one-day percentage increase since 2009. The Hang Seng and Nikkei indices also rebounded, though not as dramatically.
Asia’s rally has tentatively helped fuel substantial rebounds in European equities, including the DAX and FTSE, as well as US equities and crude oil.
In the case of the S&P 500, the index found major support this week around the 2033 level, which has been tested or approached to the downside on most days this week as China equity markets and Greece continued to weigh on the index. This key 2033 level was also tested and well-respected twice back in late March.
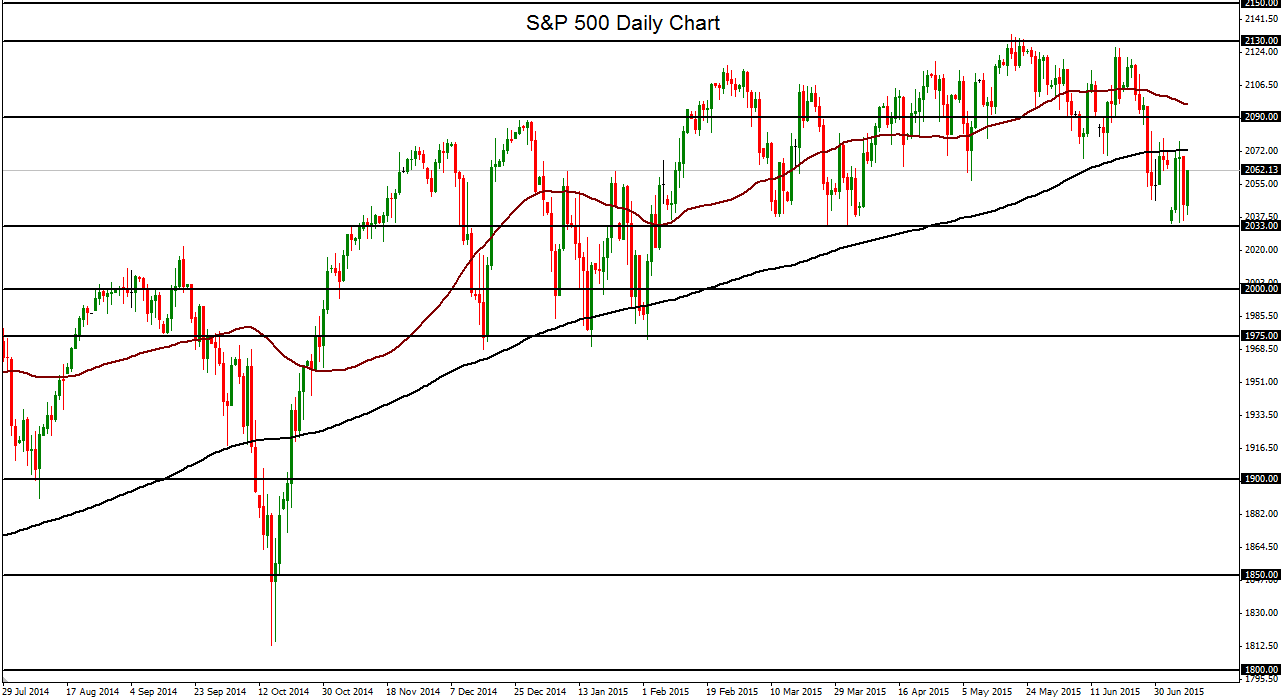
From a broader perspective, the S&P 500 is still firmly entrenched within a long-term uptrend. The index reached a new all-time high of 2134 as recently as May of this year. Since that high, the S&P has pulled back modestly but is currently far from entering into correction territory, normally defined as a pullback of 10% or more.
While this may currently be true, and the China equities markets may have been rescued for the moment by state policy and controls, further turmoil in those markets could well re-emerge. In this event, European and US indices could likely follow suit.
For the S&P 500, the key downside support level to watch remains at the noted 2033 level. Any subsequent break below that level should target further downside support objectives at the 2000 psychological level followed by key support around 1975.
To the upside, on any continued China market recovery, sustained trading above the 200-day moving average for the S&P 500 could push the index towards a re-test of 2130-area resistance.
