S amp P 500 Stocks oil regain poise after initial wobble post oil data
U.S. stocks and crude oil prices were quick to bounce back from the initial wobble in the immediate aftermath of the official US weekly oil […]
U.S. stocks and crude oil prices were quick to bounce back from the initial wobble in the immediate aftermath of the official US weekly oil […]
U.S. stocks and crude oil prices were quick to bounce back from the initial wobble in the immediate aftermath of the official US weekly oil inventories report from the EIA as traders (and algos) responded to the headline build of 1.31 million barrels. Clearly this wrong-footed many speculators who had expected to see another drawdown following last week’s 3.41 million barrel decrease in US oil stocks. On a side note, this is the second time in as many weeks that the API has got it completely wrong, assuming of course that the official numbers are correct (or less inaccurate)! But the other aspects of the oil report were not too bad at all. For one, oil production fell once again. For another, there were larger-than-expected draws in distillates and – more importantly for this time of the year – gasoline stocks as refineries processed more crude, which is normal for this time of the year as the summer driving season is underway.
But recently, the correlation between equities and crude oil has become a little weaker than it was previously. This is not a major surprise as oil prices only impact certain stocks anyway, namely energy companies, not the entire equity market. The major global indices, such as the S&P 500, are of course comprised of stocks in other key sectors that have nothing to do with oil. Stating the obvious here, but it is also not unheard of for oil prices to go down and stocks up, and vice versa. Correlations can come and go at any moment as the focus continually changes. Nevertheless, should oil prices go on to achieve new 2016 highs now and sustain their gains then equity indices could extend their gains, at least in the short term anyway. The opposite is also true.
The focus is now turning towards the Fed who will be releasing the FOMC’s last meeting minutes soon. It is likely that these minutes will convey a dovish message. For the markets to move significantly therefore, the minutes will either need to be more dovish than expected or surprisingly hawkish. If hawkish, the dollar could rally and stocks fall.
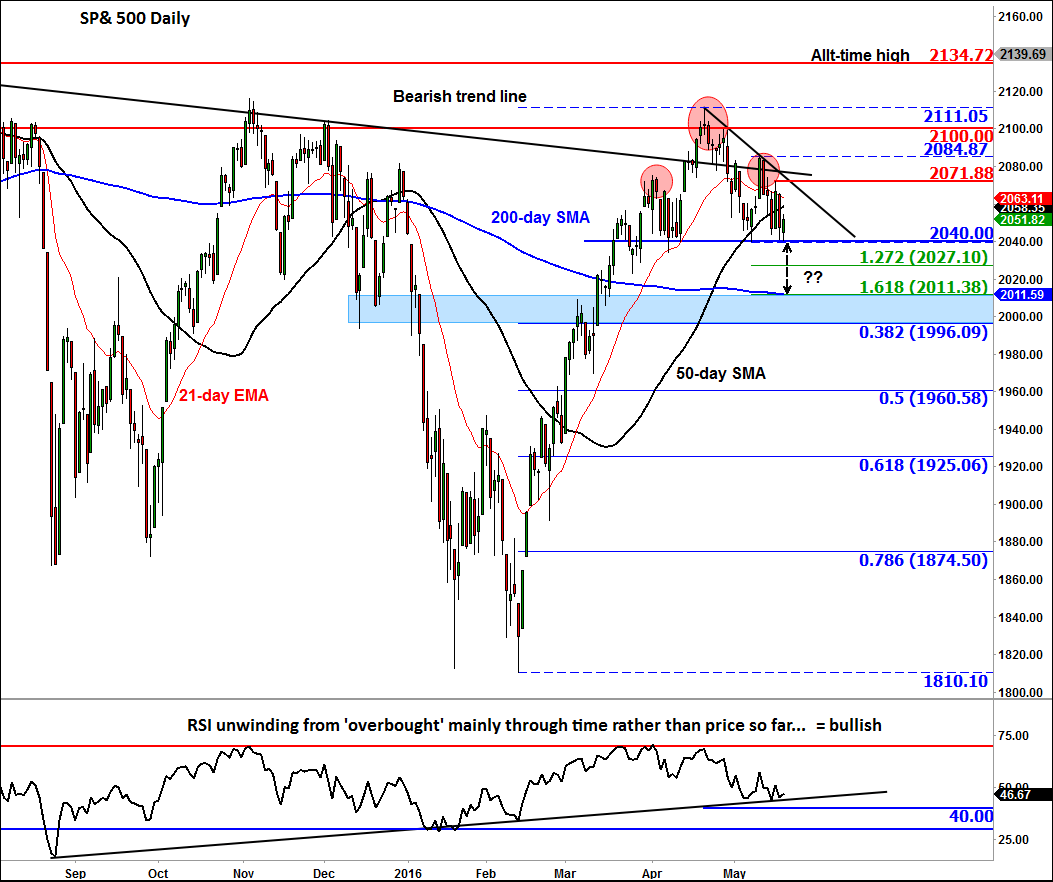
As far as the technical outlook for the S&P 500 is concerned, the US benchmark stock index is still in consolidation mode. The RSI momentum indicator has unwound from “overbought” levels after the big rally in Q1, mainly through time rather than price action, which is deemed bullish. But recent price action has been rather bearish and a near-term top may have been formed. As can be seen, a potential Head and Shoulders pattern is now visible on the daily chart of the S&P. The neckline of this pattern is still holding at around 2040, so at this stage the pattern has not been completed. But if this 2040 level were to break down then we may see a more profound correction towards the levels shown on the chart. Among them, the key level to watch – should we get there – is 2010/11, which is where the 200-day moving average converges with the 161.8% extension of the most recent bounce. Below here, the 38.2% Fibonacci retracement level of the entire 2016 range comes in at 1996.
But given the v-shaped recovery after the previous bear assault, any pullback from here should be interpreted as a short-term counter-trend move rather than the start of a massive correction. Indeed, if the S&P were to break above some key short-term resistance levels (as shown on the chart) or the bearish trend line, then we could be talking about fresh all-time highs soon, despite all the doom and gloom out there. In this trendless market, it may therefore pay to be (a) more patient and (b) nimble.