S amp P 500 small pullback before new highs
The S&P 500 is now just 20 or so points away from reaching its previous record high of 2134/5 achieved back in May 2015. Will […]
The S&P 500 is now just 20 or so points away from reaching its previous record high of 2134/5 achieved back in May 2015. Will […]
The S&P 500 is now just 20 or so points away from reaching its previous record high of 2134/5 achieved back in May 2015. Will it reach or surpass this level remains to be seen, but with oil prices rallying, Chinese data improving slightly and central banks remaining uber-dovish, I wouldn’t bet against it. That being said, profit-taking may cause the index to pause here for a while. So a short-term pullback wouldn’t surprise me either.
There is no question that within its long-term consolidation range between 1800 and 2135, the trend has been bullish for the S&P. Several attempts by the sellers to gain control of the market has failed. Some will no doubt try and exert their force once again as we approach the top of the range now. But judging by their most recent attempt to derail the rally (when a much-talked-about Head and Shoulders reversal pattern failed to materialise last month and many bears were trapped, which subsequently led to a quick short-covering rally), their efforts may prove futile once again.
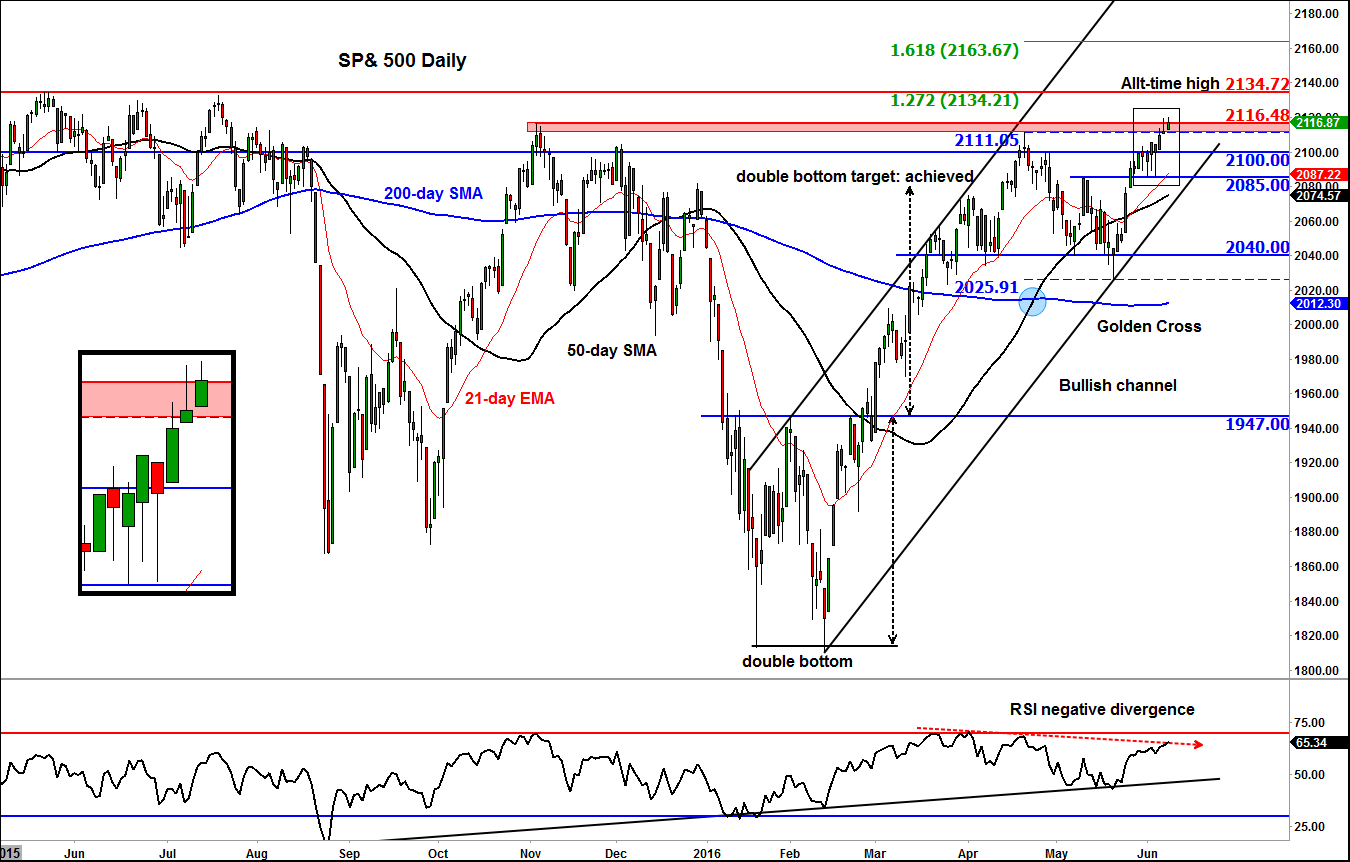
But the S&P is testing a key level today: 2116, which was the high it hit in November before it fell, slowly at first then sharply at the turn of the year. While we may not see a similar action this time, the possibility for a small pullback is there given the fact that the RSI indicator is diverging negatively with the index, which suggests that the bullish momentum may be waning. At this stage, the divergence is just a warning, not a reversal sign. For the latter to happen, the S&P will first need to form a reversal-looking candlestick pattern (such as an inverted hammer or a bearish engulfing), ideally at a major resistance level such as this 2116/7 level or the prior record high of 2134/5, and then break some major support levels for confirmation.
Even if the S&P falters around these levels, traders will need to be wary of another potential bear trap, for the underlying trend is still technically bullish – and it will remain so for as long as the index resides inside the bullish channel. Indeed, the 21-day exponential and 50-day simple moving averages are both pointing higher and the 200-day simple MA is flattening. So, a pause in the rally may not be a bad thing as far as the bullish argument is concerned.
If the S&P does pullback from here, the potential levels of support to watch for a bounce include 2111, 2100, 2085 and then 2075, where the 50-day MA meets the support trend of the bullish channel. Only a closing break below the latter would be deemed a significantly bearish scenario as that would potentially pave the way for a deeper correction and perhaps a re-test of the 200-day MA.
But if the S&P breaks through the 2116/7 resistance level on a daily closing basis today or in the coming days then a rally towards, if not beyond, the prior record high of 2134/5 would then become highly likely.