S amp P 500 set for positive start on last day of bad quarter
European and UK stocks are trading sharply higher on this last day of what has been a bad third quarter, raising suspicion that the markets […]
European and UK stocks are trading sharply higher on this last day of what has been a bad third quarter, raising suspicion that the markets […]
European and UK stocks are trading sharply higher on this last day of what has been a bad third quarter, raising suspicion that the markets may be rising because of “window dressing.” This is when fund managers buy stocks that have been performing well in order to make their portfolios look attractive, though Glencore, which has been absolutely battered of late, is up 10% after the company reassured investors that it is not going bust. As well as Glencore, the UK’s FTSE is led by supermarket shares after Sainsbury reported better than expected like-for-like sales in the second quarter. At the time of this writing, the FTSE is up 2% and similar gains are seen for Europe’s other major indices. US index futures currently point to a firmer open on Wall Street, with the S&P set to open one per cent higher, though this may change as investors react to the US ADP employment report which has just come out with a gain of 200,000 jobs.
Despite today’s gains the global stock markets have performed poorly in the third quarter. Sentiment has been rattled by signs of weakening global economic growth, most notably in China, which combined with a stronger dollar has raised serious question marks over the earnings outlook. Indeed, analysts have been continually reducing their expectations and now think US earnings will decline 4.5% in the third quarter compared to a year-earlier period while revenues would fall 3.3%, according to data from FactSet. If correct, revenues will have fallen for three straight quarters and it will be the first back-to-back quarters of declining earnings since 2009.
Japan’s Nikkei has had its worst three-month period since 2010 and Chinese stocks their worst since 2008 with a fall of almost 29% in the third quarter. The FTSE Emerging Index has plunged more than 21% in Q3, which is its worst quarter since 2011. In the US, the markets have been rising almost every year after hitting a post-crisis low in March 2009, thus it was only a matter of time before that trend ended. Though the year has not finished yet, stocks could fall this year as the Federal Reserve prepares to raise interest rates for the first time since 2006. For the quarter, the S&P 500 has so far fallen about 8, which is the biggest drop since the third quarter of 2011. As well as commodity-linked stocks, sectors that had led the market earlier this year, such as biotech and healthcare, have fallen dramatically in recent times.
Thus going into the fourth quarter, it is safe to say that sentiment is downbeat despite today’s rally. But how much of the negativity is already priced? Are the markets overreacting to the global growth concerns? Have the bears had enough? Or are we in for a much larger correction? There are so many questions, but some will be answered by this week’s key economic data releases from China, Japan, Europe and the US. The truth is that no one will know for sure when the markets will bottom out, and even though some major indices may have created potential reversal signals, such as double bottom on the German DAX index, this could prove to be a so-called suckers’ rally.
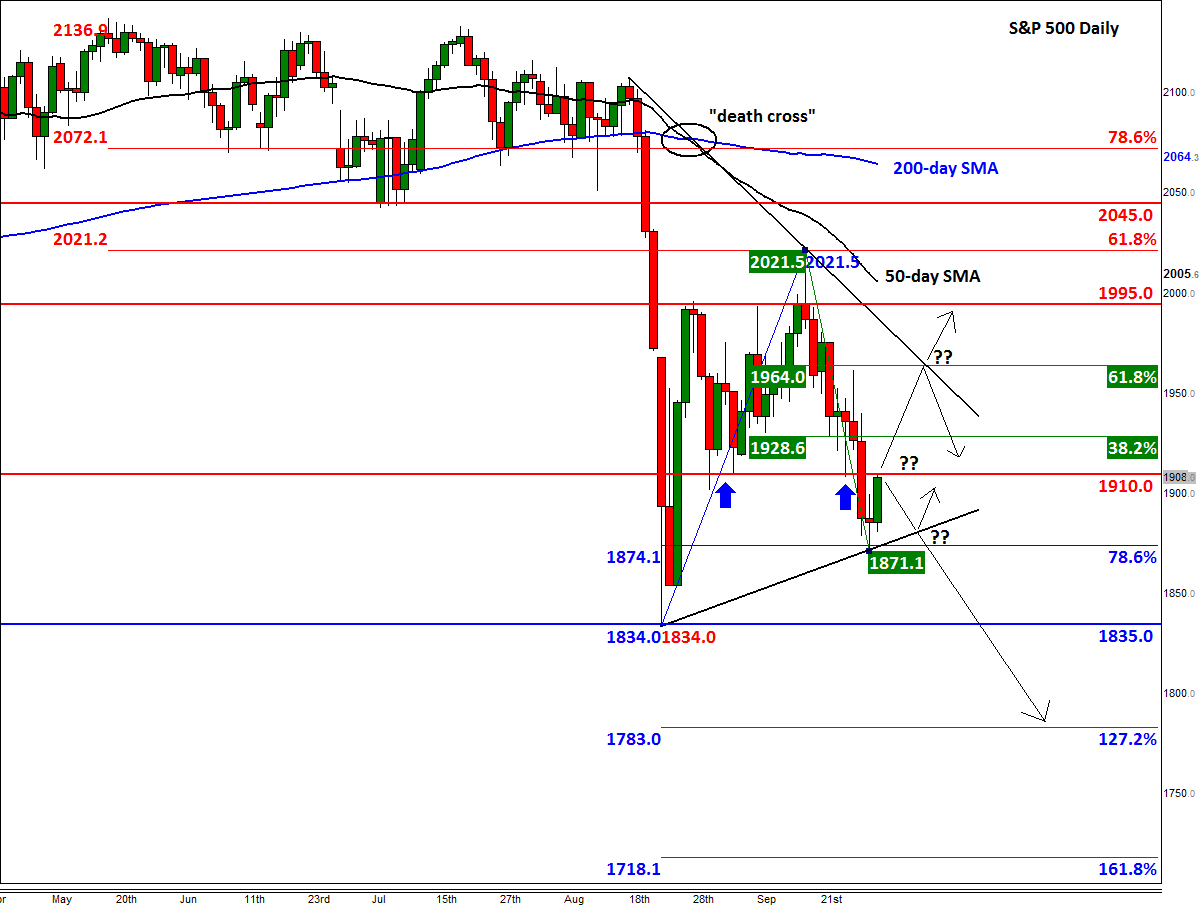
As far as the S&P is concerned, the index has bounced off the 78.6% Fibonacci retracement level of the upswing from the August low, at 1871. It is currently testing the previous support level around 1910, which could now turn into resistance and presage another sell-off. Things could then turn ugly if yesterday’s low of 1871 gets broken; in this scenario a move down to at least the August low of 1834 would be the most logical outcome. Alternatively, if the bulls take out the abovementioned 1910 resistance level then we may see a more significant rally towards the Fibonacci levels of the most recent downswing at 1928 (38.2%) or 1964 (61.8%), before the index decides on its next move. A particularly bullish outcome would be if the S&P also breaks above the bearish trend line, which comes in around that 1964 level. If seen, the index may potentially stage a sharp recovery towards its 200-day moving average, currently at 2064. For the time being though, we are giving the bears the benefit of the doubt and thus expect today’s rally to be short-lived.