Without fail, some popular financial personality will jokingly tweet “Week’s over” (or even “Month’s over”) after the release of the monthly Non-Farm Payroll report. Traders who took this common tongue-in-cheek joke too literally this month will be in for a rude awakening when they turn their attention back to the markets.
By now, most readers know that this month’s jobs report was a big disappointment. Not only did the headline number of jobs miss expectations (142k vs. 201k anticipated), but the average hourly earnings reading and revisions were also negative as well (0.0% m/m and -59k jobs, respectively). This triple whammy of negative US data predictably drove the US dollar lower, equities down, and bonds through the roof as the market began to seriously question the likelihood of the Federal Reserve raising interest rates at all this year.
Over the last six hours though, every single one of those moves has faded in a classic post-NFP v-shaped reversal. For the uninitiated, this refers to the surprisingly common tendency for traders to initially overreact to a surprising NFP report before seeing the initial move unwind over the ensuing hours. As of writing, the US dollar index has fought its way back to nearly breakeven, bonds are seeing some of their early gains evaporate and US equities are actually trading higher on the day.
Technical View: S&P 500
Focusing in on the S&P 500 reveals a very bullish candlestick in formation today. While it doesn’t come at the bottom of bearish move, it is very similar to a Bullish Pin Candle*, which shows an intraday shift from selling to buying pressure and often foreshadows more gains to come. Meanwhile, the selling momentum (as shown by the RSI indicator) has been much less severe on the most recent downswing.
With this week’s “retest” of the recent lows, US stocks may now rally back up toward the previous resistance zone in the 1995-2000 range. That said, there is plenty of overhead supply starting in that zone, so long-term bulls may want to tread with caution unless or until we can conclusively rally back above 2040. While not our base case, a break below this week’s low at 1870 would open the door for a move all the way back down toward the 1820-30 level, so the price action in the coming week will be critical.
* A Bullish Pin (Pinnochio) candle, also known as a hammer or paper umbrella, is formed when prices fall within the candle before buyers step in and push prices back up to close near the open. It suggests the potential for a bullish continuation if the high of the candle is broken.
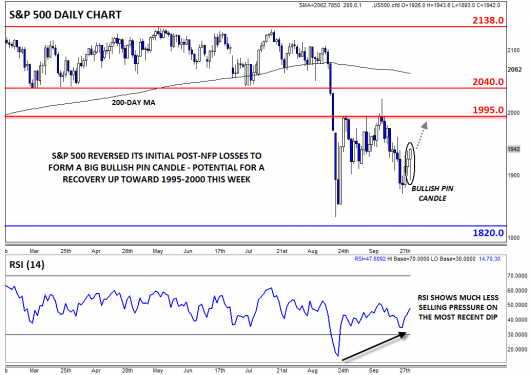 Source: City Index