S amp P 500 s Head and Shoulders pattern point to further weakness
It has been an ugly day for stock market bulls and things get even worse if the major indices fail to hold their technically-important levels […]
It has been an ugly day for stock market bulls and things get even worse if the major indices fail to hold their technically-important levels […]
It has been an ugly day for stock market bulls and things get even worse if the major indices fail to hold their technically-important levels that are being tested as I go to press. The falling commodity prices have finally taken their toll on the markets today, with concerns over an imminent rate hike from the Federal Reserve also unnerving some people. Recent macroeconomic pointers from China, including Wednesday’s factory output data, which showed activity slowed to a seven month low of 5.6% in October, continue to suggest growth in the world’s second largest economy is slowing down. In the US, the earnings season is drawing to a close and the results have not been great. There is little further catalyst to support the markets except the on-going expectations that the world’s major central banks will remain extremely accommodative for an extended period of time, and in the case of the ECB expand their bond purchases program and cut rates into the negative.
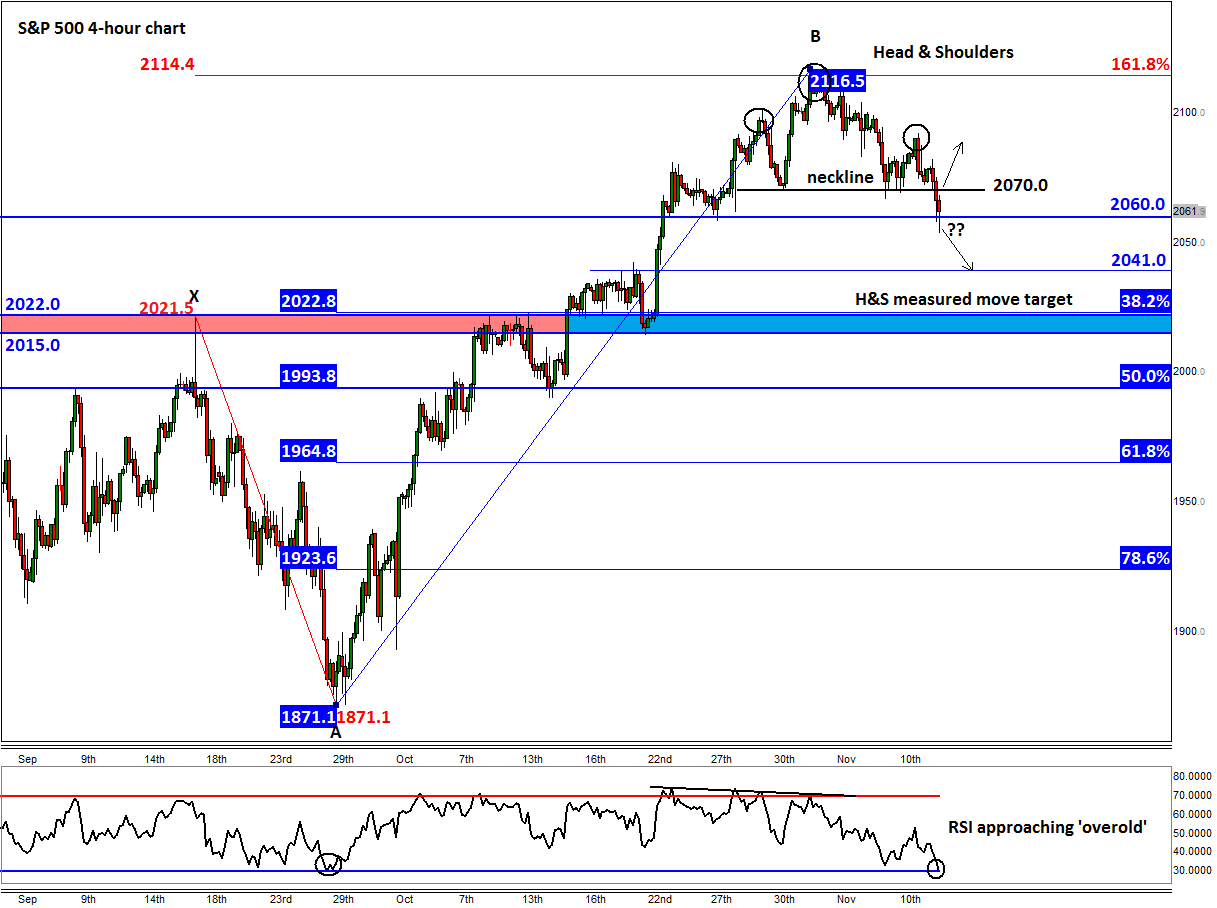
But focusing on the technical outlook of the markets today and the bears are clearly starting to once again win back control – at least in the short-term anyway. The S&P 500’s rally has stalled at the start of this month around the 161.8% Fibonacci exhaustion point of the last notable downswing we observed in September, around 2114/6. Here, bullish traders evidently took profit on their positions, particularly as the momentum indicator RSI had correspondingly been testing overbought levels of 70 and created a bearish divergence. This probably applied some downward pressure, giving the sellers some much-needed confidence.
The resulting selling pressure has now created a potential reversal pattern on the S&P: a Head and Shoulders (H&S) formation. As can be seen from the 4-hour chart, the ‘head’ was formed around the 161.8% extension of the XA price swing of 2114/6, while the neckline was formed at 2070. Today, the S&P has broken below the neckline and is now testing another support at 2060. It needs to break decisively below here now in order to confirm the turnaround. The height of the H&S pattern is thus about 46 points (2116-2070). This gives us a projected target of about 2024 (2070-46). Interestingly, the next key support area is between 2015 and 2022, which therefore comes in just below the H&S target. It is therefore likely that the S&P will at the very least stage a modest bounce around these levels, should it get there. A move below this area would thus be very bearish and could lead to a significant drop. Standing on the way of the H&S target is the previous resistance at 2040/1, which could now turn into support.
The bulls, meanwhile, will first and foremost want to see a close back above the 2060 support level, and ideally a decisive break above the neckline at 2070. If seen, the S&P may then resume its rally towards the previous all-time high.