S amp P 500 pullback at critical support
The S&P 500 (daily chart) has consolidated around a critical level of support after having pulled back from its all-time high of 1850, which was […]
The S&P 500 (daily chart) has consolidated around a critical level of support after having pulled back from its all-time high of 1850, which was […]
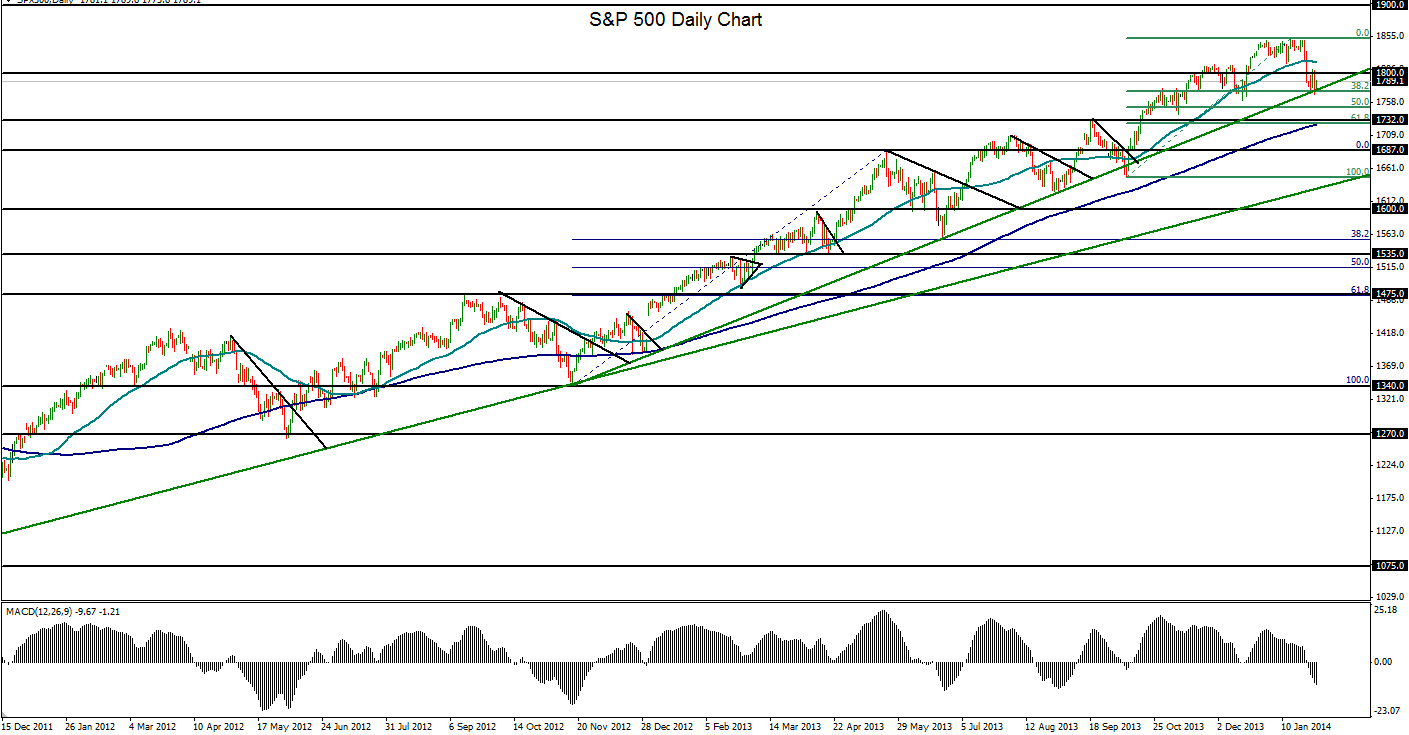
The S&P 500 (daily chart) has consolidated around a critical level of support after having pulled back from its all-time high of 1850, which was just established two weeks ago in mid-January. The pullback from that high down to its most recent low of 1770 represents only a 4.3% decline thus far, considerably short of what would be considered a full correction. This decline has brought the US equity index down to a critical level of support, which primarily consists of a clear and well-respected uptrend support line that extends back to the November 2012 low near 1343. This support also coincides with the key 38% Fibonacci retracement of the most recent bullish run (from the October 1646 low up to the noted January 1850 high).
Having reached down to this important support level, the S&P 500 is at a critical price juncture. A turn back to the upside to continue the entrenched uptrend would further reinforce the noted trend line and potentially prompt the index to seek even higher highs towards the unprecedented 1900 and 2000 levels after the current pullback. Alternatively, a breakdown below the current critical support could move the index towards full correction mode, with downside retracement targets around 1730 and then possibly towards the 1650 support region.