S amp P 500 poised for higher volatility as earnings season ends
As the tail end of corporate earnings season approaches for the US equities markets, the S&P 500 has continued to trade in a tight but […]
As the tail end of corporate earnings season approaches for the US equities markets, the S&P 500 has continued to trade in a tight but […]
As the tail end of corporate earnings season approaches for the US equities markets, the S&P 500 has continued to trade in a tight but choppy fashion, straddling its flat and closely-situated 200-day and 50-day moving averages.
Despite a summer that has had its fair share of macro-driven volatility triggers, including the Greek debt crisis, continuing drama over the timing of a Fed rate hike, the widespread commodities plunge, and China’s equity nosedive and devaluation of its currency, the S&P 500 has managed to remain relatively buoyant and is currently trading around where it began the summer.
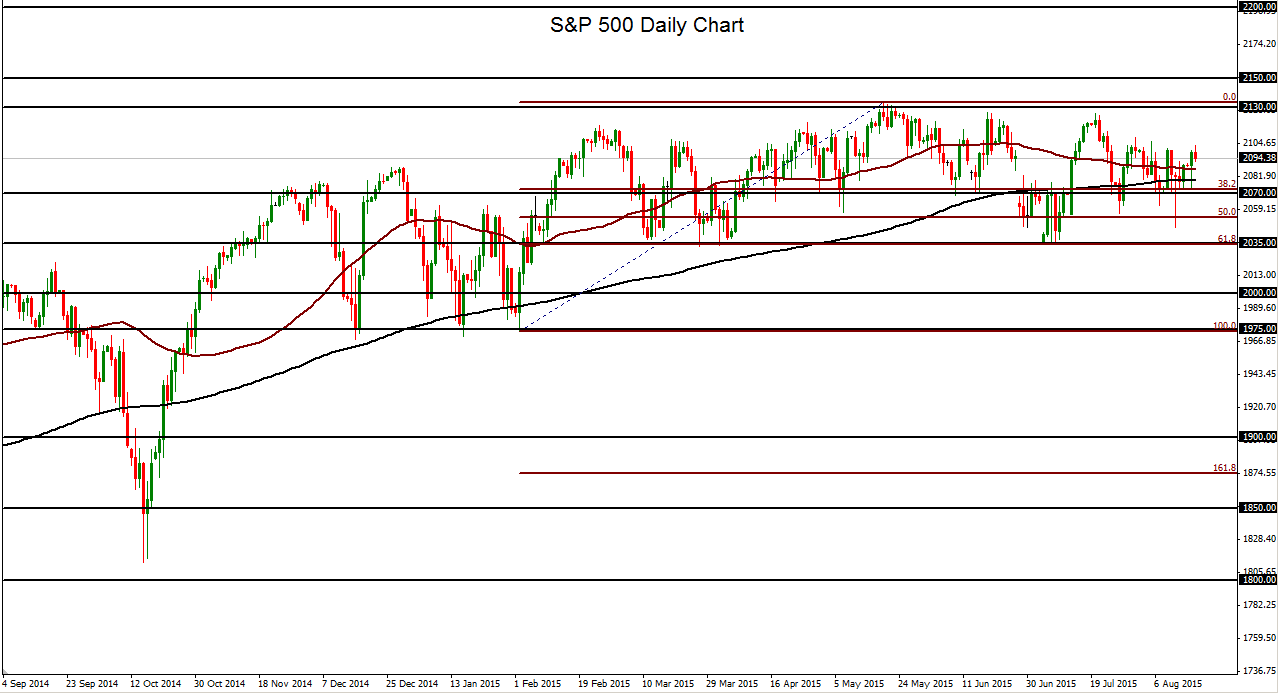
In fact, since February, the benchmark index of US equities can clearly be seen to have been trading within a large trading range with the 2035 price area as its support base. Within the course of this range, of course, the index reached a new all-time high of 2134 in May. That high was the latest culmination of a prolonged bullish trend that has been in place for more than six years.
As earnings season and the summer comes to a close, however, the market’s attention should once again be focused on pressing macro concerns, most notably Fed monetary policy tightening and China’s turbulent financial and economic environment. These and other fundamental conditions could lead to a breakout of the current volatility squeeze.
This volatility breakout could likely pressure the S&P 500 to the downside towards the noted 2035 support base, the low of the current trading range that was last revisited in early July. Even a move of this magnitude, however, would only constitute a pullback of less than 5% from May’s all-time high, far from what might be deemed a correction. On any further breakdown below that 2035 support area, the index could likely drop towards its next major downside support target around the 1975 level, which was last hit in early February.
