S amp P 500 poised for a true correction
The S&P 500 index (daily chart shown below) hit a new intraday high of 1883 exactly one week ago, closing on March 7th at a […]
The S&P 500 index (daily chart shown below) hit a new intraday high of 1883 exactly one week ago, closing on March 7th at a […]
The S&P 500 index (daily chart shown below) hit a new intraday high of 1883 exactly one week ago, closing on March 7th at a record closing high of 1878.
Since that new all-time height was reached, the US equity index has spent much of this week pulling back to less lofty levels.
The last time that the S&P 500 pulled back significantly was in late January, when it fell from a high of 1850 down to a low of 1737, for a 6% bearish retracement.
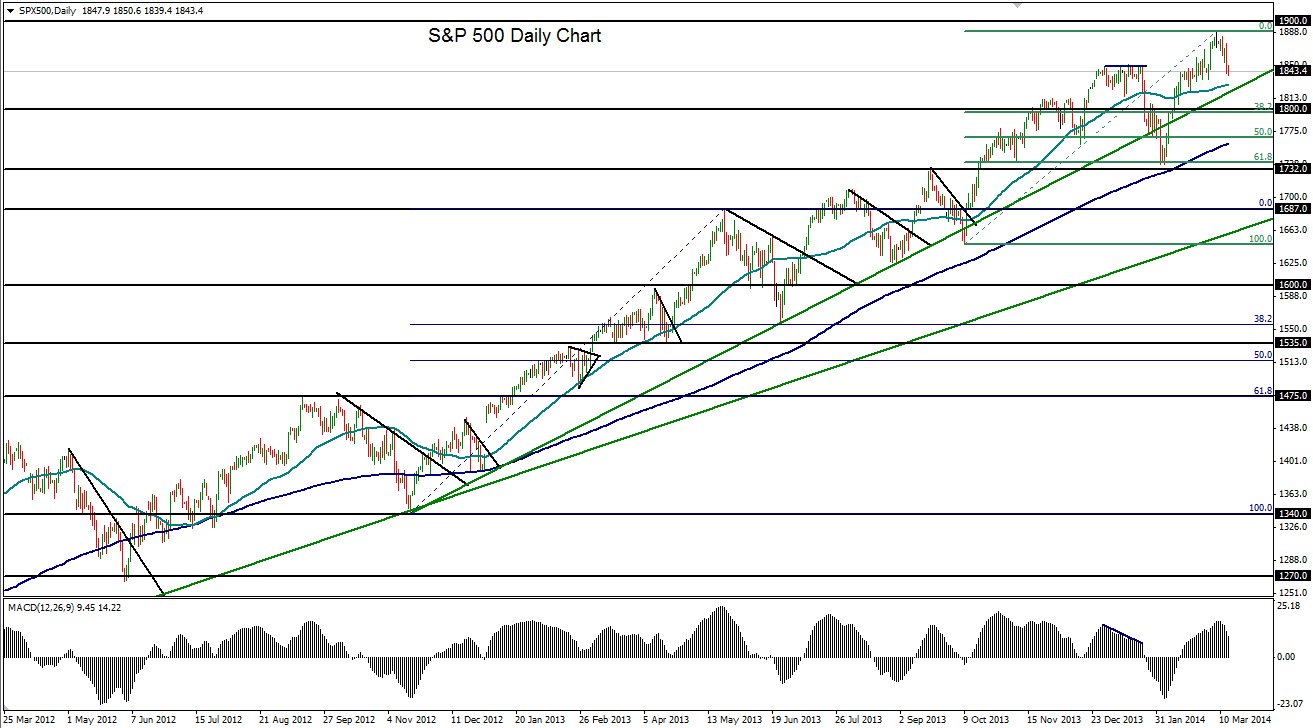
This fell short of qualifying as the true correction that many were expecting, which is usually defined as a decline of 10% or more.
While the long-term bullish trend is still strongly intact at the moment and the index is trading well above major technical levels; including both the 50-day and 200-day moving averages, a deeper pullback or correction from the currently well-overbought levels should soon be due.
A true correction from the current record high would place the index below the 1700 level.
Before such a low could potentially be hit, however, key support areas around 1800 and 1735 would need to be breached, not to mention the 200-day moving average, which has not been broken down since late 2012.
