S amp P 500 on shaky footing as growth concerns mount
The global stock markets have begun the month of September on a downbeat note. Equity markets in Asia fell across the board overnight and European […]
The global stock markets have begun the month of September on a downbeat note. Equity markets in Asia fell across the board overnight and European […]
The global stock markets have begun the month of September on a downbeat note. Equity markets in Asia fell across the board overnight and European indices are deep in the red at the time of this writing, led by stocks sensitive to China such as miners and luxury goods makers. US index futures point to a sharply lower open on Wall Street. Sentiment has been hurt by renewed concerns about the health of the global economy after the latest purchasing managers’ indices (PMIs) for the manufacturing industry disappointed expectations. Although it may be a bit premature, but this bout of selling pressure may well turn out to be a continuation of the bear trend that had already begun in the summer. If it plays out this way then we could see some sharp falls this week.
The risk-off tone was triggered first in China where the official PMI contracted to a three-year low of 49.7. Most of the closely-watched sub-indices also fell below 50: new orders declined to 49.7, while new export orders dropped to 47.7. With the manufacturing PMI remaining below the expansion threshold of 50.0 since July and having spent most of the year hovering around this level, this is a worrying sign for the world’s second largest economy, and indeed the global growth prospects. Worryingly, activity in China’s services sector also disappointed last month, as the Caixin services PMI dropped to 51.5 from 53.8 in July. The disappointment did not end there. Although the latest European PMIs from Spain, France, Italy and the UK showed slight expansion, they still failed to live up to the expectations and the pace of growth slowed from July. But it wasn’t all doom and gloom as the German unemployment fell more sharply than expected while the Eurozone unemployment rate unexpectedly dropped to 10.9% in July from 11.1% in June.
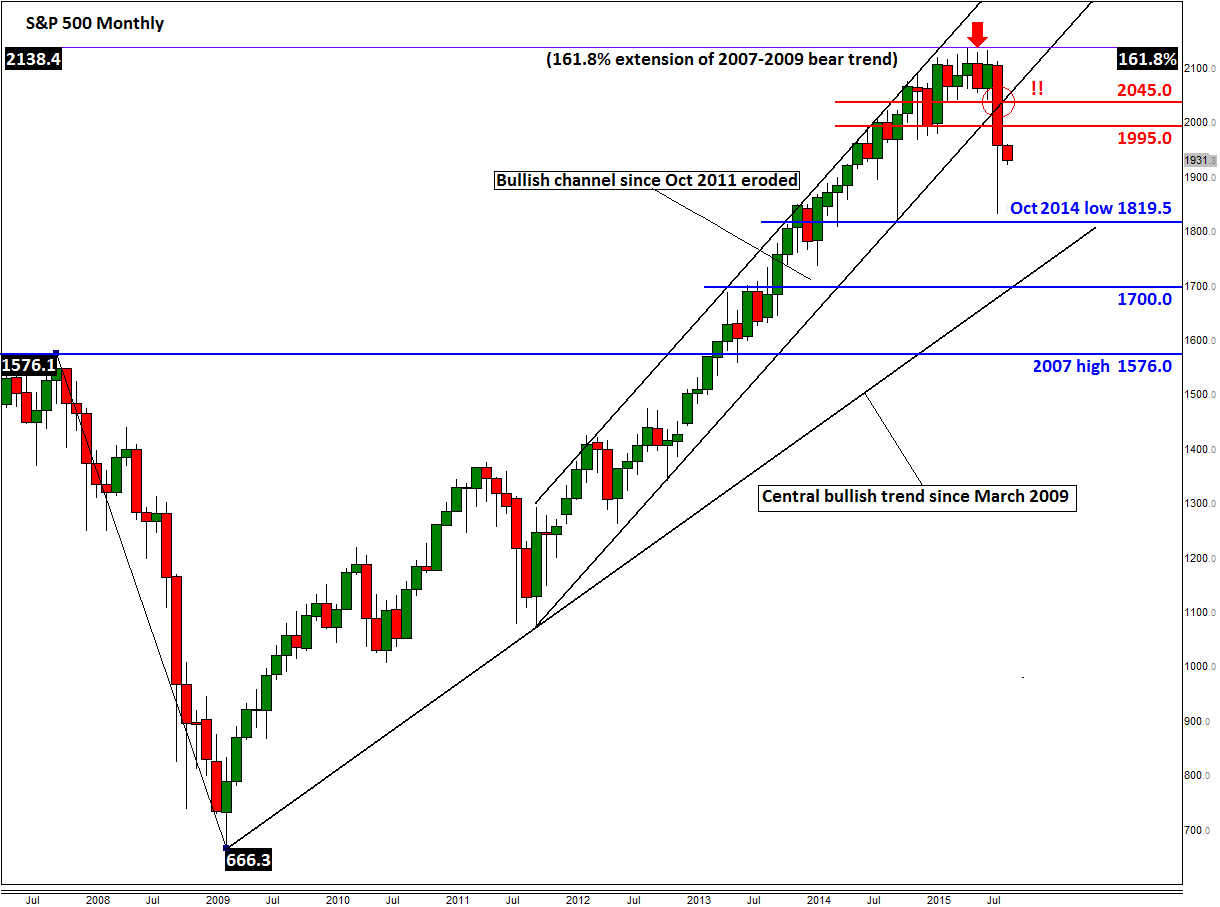
The health of the world’s largest economy will be in focus as we have several top-tier macroeconomic pointers from the US scheduled for release this week, culminating in Friday’s much-anticipated nonfarm payrolls data. But ahead of that and despite last week’s sharp rebound, the technical outlook does not look great for the US indices. Take the monthly chart of the S&P, below, as an example. As can be seen, the rally that began in March 2009 looks to be coming to an end this year. Following last month’s sell-off, the S&P has broken outside of a bullish channel that had been in place since October 2001. The S&P had already reached an exhaustion area before the summer had begun at 2138, a level which corresponds with the 161.8% Fibonacci extension of the index’s entire 2007-09 bear trend.
Going forward, our long-term-focused traders will want to keep a close eye on the October 2014 low at just below 1820. This level was missed by about 15 S&P points during last week’s earlier sell-off. But if now the index goes on to break below this 1820 level then it may make a move towards the central bullish trend line that has been in place since March 2009, at 1700. Thereafter is the 2007 high at 1576, a level which could turn into support upon re-test. Admittedly, these level are miles away from where we stand at the moment but if the proverbial you know what hits the fan then we could get to these levels fairly quickly. Meanwhile on the upside, a break above last week’s high at 1995 should be a bullish development in the short term, which may pave the way for a rally towards the next resistance at 2040.