S amp P 500 Massive long term support zone under threat
At the beginning of last week, we provided a “check-up” midway through the Q4 earnings season for the S&P 500, concluding that the four biggest […]
At the beginning of last week, we provided a “check-up” midway through the Q4 earnings season for the S&P 500, concluding that the four biggest […]
At the beginning of last week, we provided a “check-up” midway through the Q4 earnings season for the S&P 500, concluding that the four biggest themes were “falling earnings and sales, weak performance out of the energy sector, continued improvement in margins, and the dramatic impact of the US Dollar.” We’ll provide a full summary of the reports when earnings season is winding down, but once again, it looks like large US companies will see a decline in aggregate earnings and revenues.
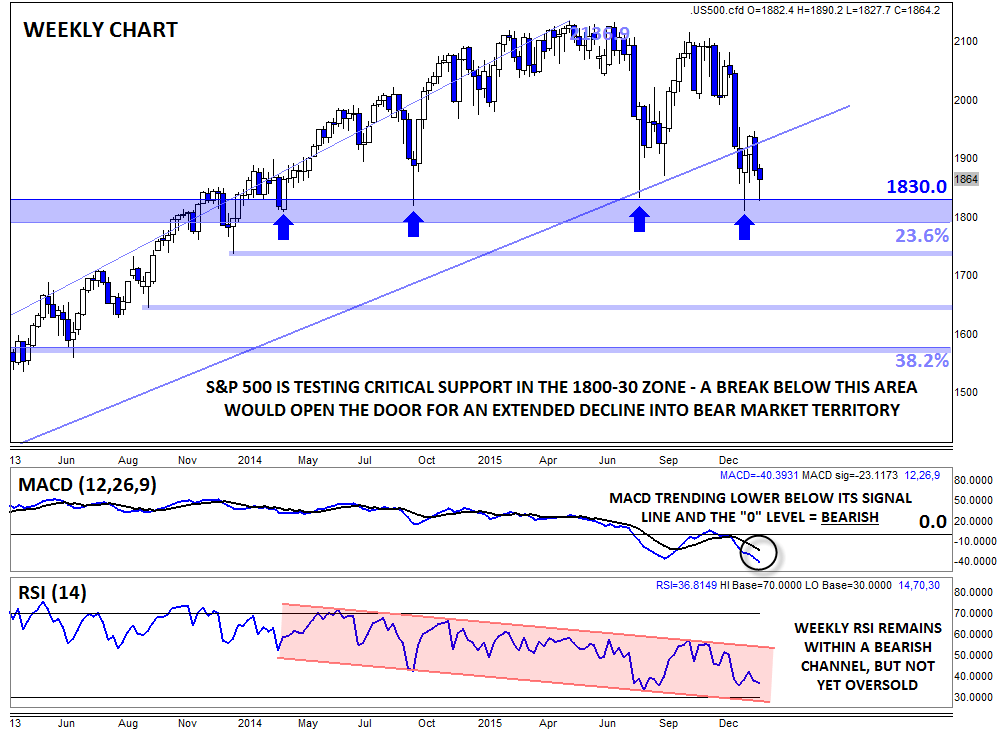
At the moment though, the more pressing issue is the technical picture. After the big drop to start the year, the S&P 500 has now broken below the nearly 7-year bullish trend line (arithmetic chart) off the 2009 lows and is testing a critical support area in the lower-1800s. This zone represents the previous lows from April 2014, October 2014, August 2015, and January of this year, as well as the 23.6% Fibonacci retracement of the whole 2009-2015 rally (1791). Bulls would argue that we’ve seen meaningful rallies the last four times we tested this support zone, though bears would be quick to note that the magnitude of those rallies has been declining (from a 300+ point move in 2014-2015 to a 280 point rally last year to just a 135 point rally over the last few weeks before we rolled over once again).
Not only are we seeing less and less conviction on each subsequent rally off the 1800 support zone, but the secondary indicators on the weekly chart are also more bearish than they’ve been in years. For one, the weekly MACD indicator is trending sharply lower below both its signal line and the “0” level, showing growing bearish momentum. Meanwhile, the weekly RSI remains within a 2-year bearish channel and is not even in oversold territory, suggesting that the index could fall further if 1800 support gives way.
Below 1800, there’s not much in the way of meaningful support until down around 1600; that said, we could see buyers step in around the minor lows at 1740 (Feb 2014) or 1640 (Aug-Oct 2013) along the way. Of course, betting against the long-term uptrend in stocks has been a fool’s errand over the last half-decade or so, so bears may opt to cut losses quickly, especially if the S&P 500 recovers back above last week’s high and the broken bullish trend line in the 1950 region.