S amp P 500 maintains strength despite pressure
The S&P 500 (daily chart shown below) has continued to maintain altitude just off its record high of 1883 that was established last week. The […]
The S&P 500 (daily chart shown below) has continued to maintain altitude just off its record high of 1883 that was established last week. The […]
The S&P 500 (daily chart shown below) has continued to maintain altitude just off its record high of 1883 that was established last week. The new all-time high just barely broke the previous record, also at 1883, that was set in early March.
After a week that has been tarnished by a general market sell-off, especially in momentum stocks, the S&P 500 market index staged a rebound attempt as of early Friday, continuing to maintain its dizzying strength.
The last time that the S&P 500 pulled back significantly was in late January, when it fell from a high of 1850 down to a low of 1737, for a 6% decline.
Since then, after posting new record highs, the US equity index has made only minor pullbacks above its 50-day moving average.
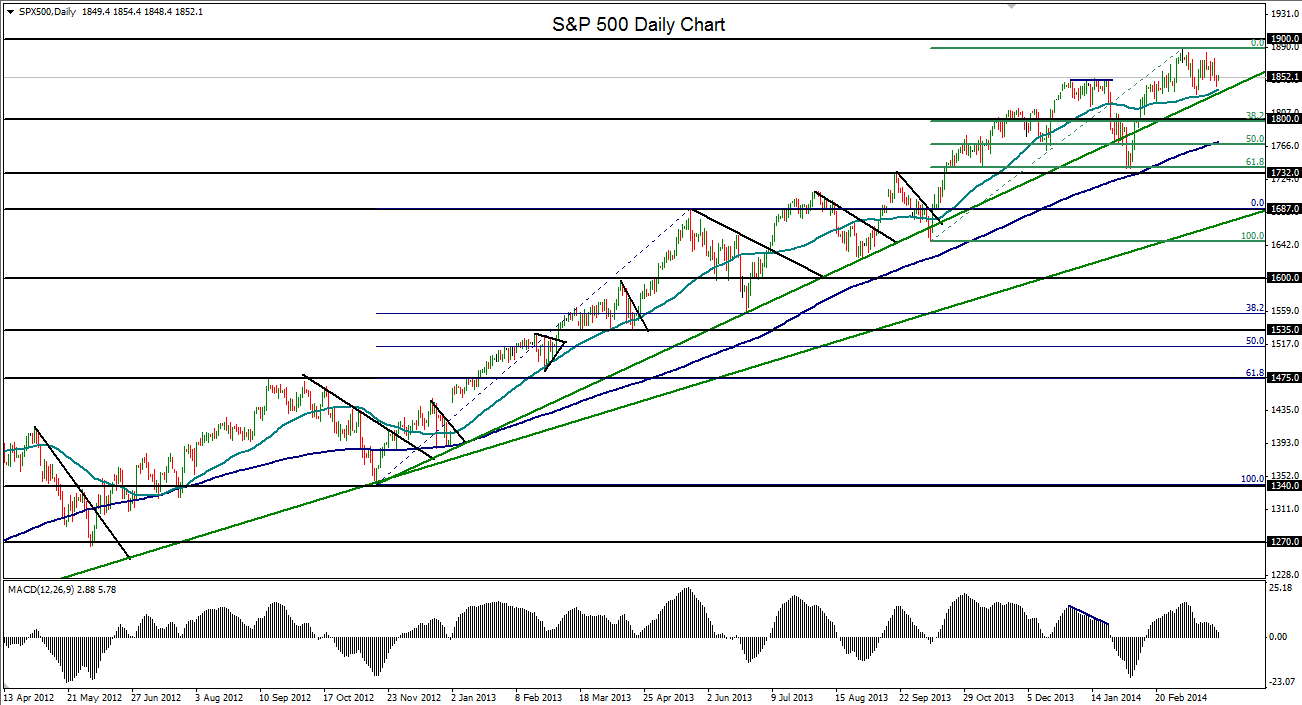
While the long-term bullish trend is still fully intact at the moment, and the index is trading well above major technical levels, a deeper pullback or correction from the currently well-overbought levels should soon be due.
The question now is, which level will be hit first? The 1900 upside target or the 1800 downside retracement level?
Any impending failure near the record highs should prompt a deeper pullback at least to major support around 1800.
