S amp P 500 Is the rally finally running out of brea d th
The following is the updated version of a report that I wrote for the July issue of Modern Trader magazine: There’s no two ways about […]
The following is the updated version of a report that I wrote for the July issue of Modern Trader magazine: There’s no two ways about […]
The following is the updated version of a report that I wrote for the July issue of Modern Trader magazine:
There’s no two ways about it: betting against the S&P 500 uptrend has been a fool’s errand over the last few years. It’s now been nearly four years since the S&P 500 last saw a 10% pullback, the third-longest streak in the last half century and well beyond the historical average of one such correction per year. Some traders may argue that this means that a drop is long overdue, but that thought process is already littered with the bodies of other too-early bears. So why would any trader want stand in the way of the runaway bullish freight train?
For one, there are some alarming fundamental developments that we haven’t seen since the bull market kicked off in 2009, and in some cases, since the start of recorded history. Even the most ardent of stock market bulls will admit that stocks are fully valued, if not outright expensive relative to history. The S&P 500’s trailing P/E ratio currently sits well above its long run average at about 21, with longer-term valuation measures like the 10-year cyclically-adjusted P/E ratio coming in at 26, nearly 60% above its historical mean. While stocks could easily become even more richly valued over the next few months, it’s difficult for bulls to make a case that they’re buying at an attractive level relative to history.
Meanwhile, S&P 500 companies saw an outright contraction in revenues in both Q1 and Q2, and earnings were also negative in Q2, despite aggressive cost cutting. These cost cutting measures may not be sustainable in the long run, especially with labor market tightening across the board; to wit, the June JOLTS jobs openings report showed a nearly record-high 5.2M job openings, meaning that employers may soon have start hiking wages aggressively to attract qualified candidates.
Of course, bulls argue that the lackluster Q2 earnings results were driven by temporary factors, including the negative impact of falling oil prices on energy companies and the sharp rise in the value of the US dollar, which hurts the profits of multinational companies. Unfortunately, oil prices remain in the dumps, but the true wildcard is the greenback. As I go to press, futures markets, economist surveys, and the Federal Reserve itself still expect the central bank to raise rates at some point this year, likely either in September or December. This marks a sharp monetary policy divergence between the US and the rest of the developed world and may continue to attract funds to the dollar in the coming months. The impact of a strong dollar on corporate earnings is often over-exaggerated, but the potential for continued strength in the dollar could still provide a headwind for large company earnings nonetheless.
In addition, traders are aggressively borrowing to buy stocks on margin, a historical warning sign for the S&P 500. NYSE margin debt recently hit an all-time high above the $500B threshold, signaling potentially excessive speculative froth in the market. This indicator is by no means a precise timing tool, but it helps to illustrate the high level of exuberance in the market.
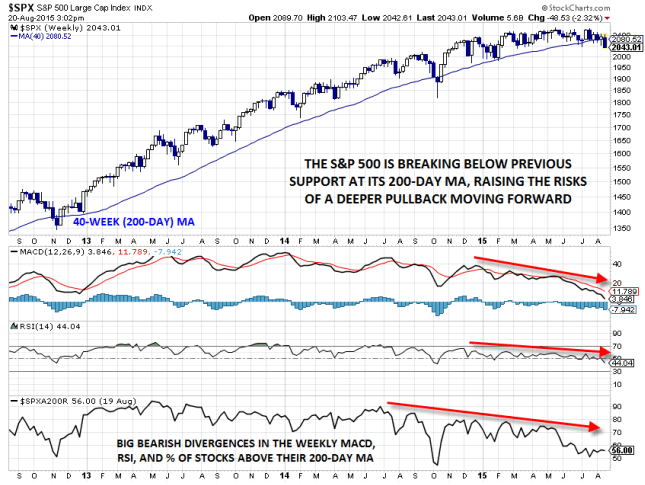
Many of these fundamental concerns could be shrugged off if we weren’t also seeing technical signs that the market was losing steam. Unfortunately, that’s not the case. As of writing, the S&P 500 is actually trading lower on the year, despite being in the historically-bullish third year of a presidential cycle. More to the point, the index has been unable to maintain a breakout to all time highs for more than a few weeks since the start of the year. The sputtering uptrend is particularly evident in the weekly chart, where both the MACD and RSI indicators are showing prolonged bearish divergences, confirming the waning momentum.
Taking a look “under the hood” at the market’s internals shows an additional reason for concern: the number of stocks participating in each subsequent rally is falling. One of the most straightforward ways to measure market breadth is too look at the percentage of stocks trading above a key moving average. When it comes to the S&P 500, there have been fewer and fewer stocks trading above both their 50- and 200-day moving averages on each index peak since the start of the year. This narrowing breadth shows that traders are increasingly piling into a few crowded market leaders; in other words, the stock market is still rising, but the “market of stocks” is not rising in sync.
The panoply of bearish developments is enough to put any reader on edge, but at the end of the day price will always be the most important indicator. To that end, S&P 500 traders may want to keep a close eye on previous support at 2040; if that level gives way, it could be the proverbial “straw the breaks the bull’s back.”
Source: Stockcharts.com,City Index
For more intraday analysis and market updates, follow us on twitter (@MWellerFX and @FOREXcom)


