S amp P 500 hits new highs where to next
So, the S&P 500 is rallying to fresh unchartered territories today. Where do we go from here? Well, the monthly chart suggests onwards and upwards. […]
So, the S&P 500 is rallying to fresh unchartered territories today. Where do we go from here? Well, the monthly chart suggests onwards and upwards. […]
So, the S&P 500 is rallying to fresh unchartered territories today. Where do we go from here? Well, the monthly chart suggests onwards and upwards.
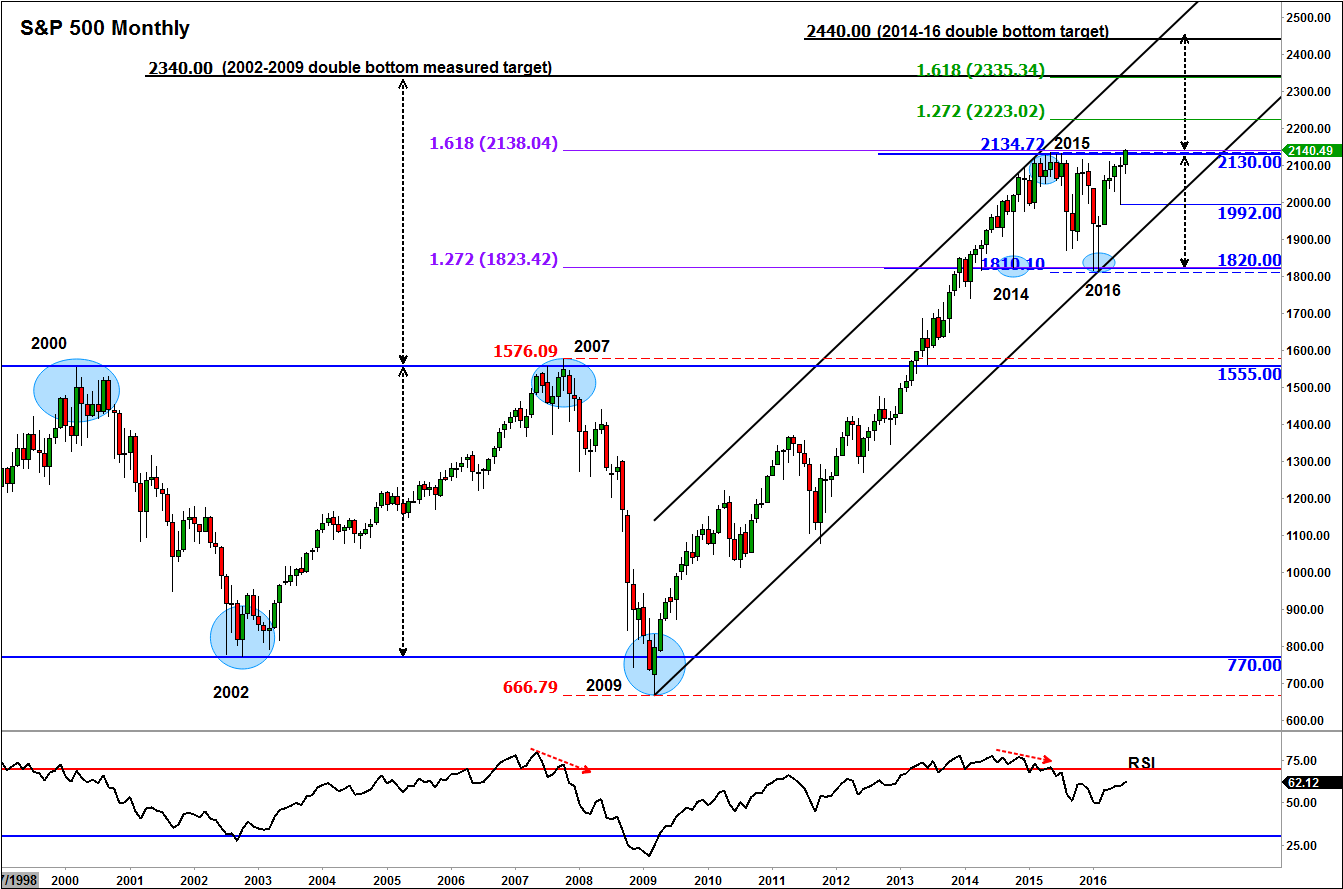
After a two-year consolidation period between around 1820 and 2130, the top of this range has been breached. Provided that the buyers will be able to hold their ground at these new highs this week so that this is not false breakout (like the 2007 scenario) then significant gains should be on the way.
The length of this consolidation has been about 2 year and now that the buys have apparently come out victorious, it could take a long time before the market becomes ‘overbought’ again. Indeed, with the monthly RSI being at 62, it has a long way to go until it reaches the 70 threshold which is where you would expect the bullish trend to at least pause for breath.
As the S&P is trading at new record levels, there are no prior reference points to provide guidance in terms of where the next visible potential resistance levels reside. This is where Fibonacci extension levels come handy, which traders use, among other tools, to provide themselves with objective targets.
The previous rally, from 2009, had stalled around the 161.8% Fibonacci extension level of the downward move from 2007-2009, at 2138. The same extension level for the 2015-2016 period is at 2335. This level also roughly converges with the top of the bullish channel and the 2002-2009 double bottom measured move target at 2340. The same measured move target for the 2014-16 phase is at 2440. A more immediate bullish target is at 2223, the 127.2% Fibonacci extension level of the 2015-2016 downswing.
So there you have it: some of the long-term bullish targets to watch include 2223, 2335/40 and then 2440.
The bears will need to be extremely patient now. They will either need to see a false breakout scenario unfold here or for the index to reach a price exhaustion zone (such as the levels mentioned above) and confirmed by a reversal-looking candlestick formation. Until such a time one of these developments occur, the bulls will be in full control.