S amp P 500 ends roller coaster Q1 higher expect more volatility in Q2
Today marks the last trading day of March and also the end of first quarter of 2016, and what a roller-coaster quarter it has been […]
Today marks the last trading day of March and also the end of first quarter of 2016, and what a roller-coaster quarter it has been […]
Today marks the last trading day of March and also the end of first quarter of 2016, and what a roller-coaster quarter it has been for U.S. and global equities! A big sell-off at the start of the year for the S&P 500 was followed by a modest rebound and then another sell-off which failed to penetrate the prior low, leading to a sharp bounce in the second half of February which has continued throughout March. Sentiment turned sour at the start of the year after the Fed signalled it would embark on a rate-hiking cycle in 2016 and as growth in China continued to slow down while oil prices dropped to fresh multi-year lows on excessive supply worries. Investors fretted over the impact of a stronger dollar on US exports and earnings, and the potential for currency crises in some emerging markets on expectations that investors may move and park their funds in the US.
But as the Fed started to backtrack on its commitment of four rate hikes in 2016 so too did speculators on their bearish equity positions. Meanwhile oil prices started to recover and this helped to boost commodity stocks in particular. The resulting rebound was initially dubbed as a bear market oversold bounce, which soon became another “hated rally.” Most traders probably got trapped trying to fade the rallies while others missed the opportunity to get in on the long side as the rally never pulled back far enough to make it worthwhile to take the risk. It was probably a very frustrating quarter for most, but hopefully a really good one for some.
Second quarter could be just as volatile as Q1
Looking ahead to the second quarter and the topics that dominated the headlines in the first three months of the year will likely repeat. Chief among them will be oil prices. It is hoped that Russia and large OPEC members will agree to freeze oil production at January’s levels in a bid to shore up prices. In the US, the start of the driving season could help to keep demand for gasoline elevated while continued decline in drilling activity means supply will likely fall further. Consequently, a more balanced oil market will probably be the outcome, which should in theory help to support oil prices. However, if global crude supply increases further, say as a result of Iran continuing to ramp up production, then this could keep prices and commodity stocks under pressure for some time yet. Equities will also find direction from interest rate decisions from major central banks, the vast majority of whom remain pretty much dovish. Many bullish speculators will hope that the Fed will now want to hold off fire until the start of the third quarter before raising rates again. The focus will also be on Q1 earnings results, as well as worries about global growth and lest we forget, Brexit risks.
So, the second quarter could be another volatile one for equities and indeed other financial markets. The second part of the quarter is usually when equity markets peak until the end of the third or start of the fourth quarter. So if we were to see some further gains, it will most likely happen in the first part of the second quarter rather than the latter half. But the long-term charts of the S&P show conflicting technical signals, so it is extremely difficult to say how the markets will behave over the next few weeks especially after the strong rally we have already seen which may lead to some sort of consolidation initially.
Technical outlook: S&P 500 shows mixed signals
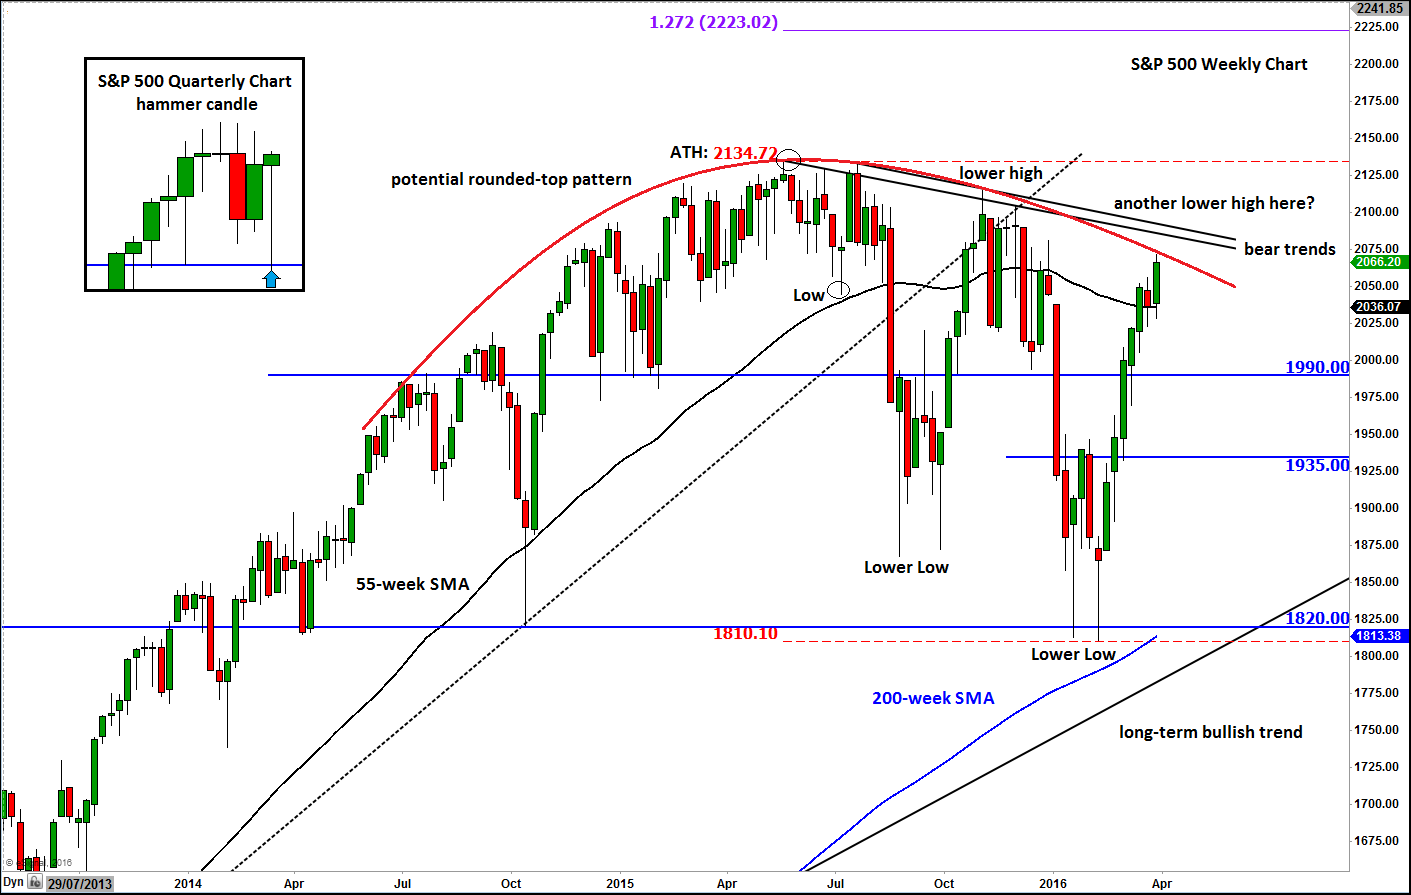
That being said, the quarterly chart of the S&P, in the inset, is displaying a rather bullish-looking hammer candlestick formation following the v-shaped recovery over the past three months. Usually, this sort of price action leads to significant continuation in the trend, which in this case is to the upside. But zooming out a little to the weekly chart and we can see that there is a potential rounded-top pattern in the making. For this pattern to remain valid, the S&P will need to hold below the bearish trend line around the 2080/90 area. Apart from this potentially bearish pattern, the index has also made a couple of lower lows and a lower high, too. Will it create another lower high around the bearish trend lines? Time will tell. Whatever happens, keep a close eye on the key support and resistance levels shown on the chart, for if a few support levels start to break down then things could turn ugly very quickly – just like last time.
In the event that the S&P fails to hold below the bearish trend lines then a rally towards the previous all-time high at 2134/5 area would become highly likely in the second quarter. What happens next will depend on price action around this level and sentiment at the time. A big rejection would create a double top reversal pattern while a decisive breakout above the all-time high will be a significantly bullish outcome because of the length of time the index has effectively spent in consolidation i.e. almost 2 years. If the S&P does break through the previous all-time high, then at the very least I would expect it to reach the 127.2% Fibonacci extension level of the most recent correction, at around 2223.00.
An alternative scenario would be if we see some more side-ways trading action inside the large ranges, without creating a distinct reversal pattern in either direction. This probably won’t be a bad outcome as far as trading is concerned; if anything, it would just open more opportunities for both the bulls and the bears alike. In this potential scenario, selling near the top of the range after confirmation and buying near the bottom of the range after confirmation could work as a good strategy.