S amp P 500 Could US stocks hit fresh highs in early 2016
It is the last full trading day of 2015 as the major global stock exchanges will either be shut tomorrow or close early due to […]
It is the last full trading day of 2015 as the major global stock exchanges will either be shut tomorrow or close early due to […]
It is the last full trading day of 2015 as the major global stock exchanges will either be shut tomorrow or close early due to the New Year’s Eve and will remain closed on the New Year’s Day. Normal trading will resume from Monday January 4. Understandably, the economic calendar is very quiet, although later on in the day we will have the latest US pending home sales and crude oil inventories data, which could offer some volatility. Tomorrow’s key US data will include the weekly unemployment claims and Chicago PMI. Clearly, there is not much fresh fundamental stimulus to provide direction for the equity markets, except perhaps the potential volatility in energy stocks should oil prices move sharply on the back of the US crude inventories data. Consequently, we are concentrating on the technical analysis side of things today.
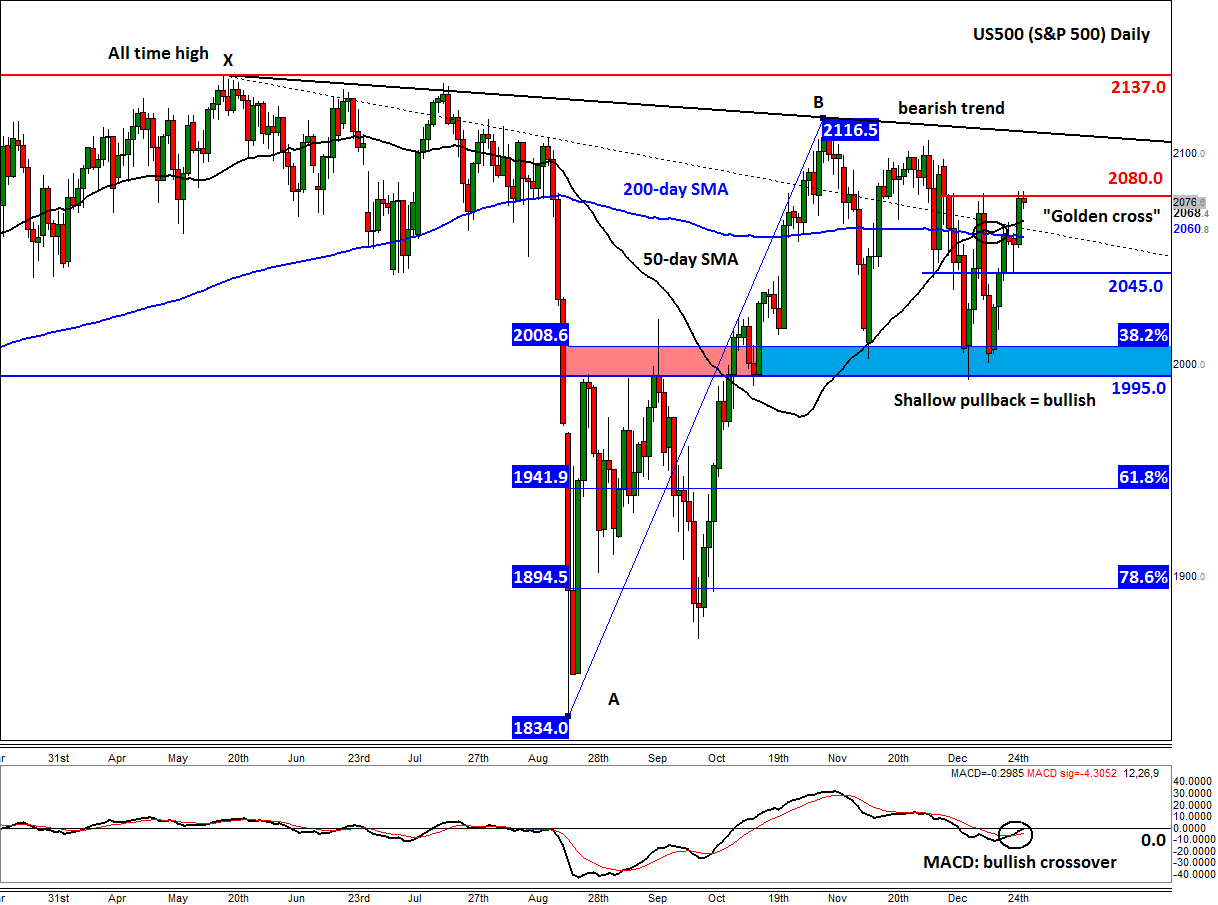
Below, we are looking at the daily chart of the S&P 500. Though technically speaking, the index is still in consolidation, a closer inspection reveals some bullish indications. For a start, the bears have now had at least three failed attempts at trying to break the key support around 1995-2008 (shaded in light blue), an area which was formerly resistance. Relative to the last sell-off that occurred at the end of the summer, these latest futile attempts to move lower have also been shallow, with the index repeatedly finding good support around the 38.2% Fibonacci retracement level (~2008) of the up move from the August low. The shallow retracements suggest the bulls have more control.
Added to this, some of the lagging indicators are also now turning bullish. The 50-day moving average (2068) has already moved above the 200 MA (2060) again to create a so-called “golden crossover,” while the momentum indicator MACD has just formed its own “bullish crossover.” The golden cross is an important development for some momentum traders. This group of market participants typically only buy when an asset’s moving averages are in this order (of course, only when their other entry criteria are also met). The last time the S&P’s golden cross occurred was in early 2012, which saw the index climb steadily for the next few years until a “death cross” (i.e. 200 SMA < 50="" sma)="" was="" formed="" this="" august.="" although="" we="" always="" warn="" that="" historical="" data="" is="" not="" a="" good="" indicator="" of="" future="" performance,="" the="" markets="" do="" tend="" to="" move="" higher="" when="" a="" golden="" cross="" happens.="" in="" the="" case="" of="" the="" s&p,="" this="" crossover="" had="" occurred="" some="" 22="" times="" since="" 1970,="" according="" to="" dow="" jones.="" of="" those="" occurrences,="" the="" index="" traded="" higher="" 19="" times="" a="" year="" later.="" this="" would="" thus="" be="" the="">rd crossover since 1970. Will we see higher stock prices in 2016?
But the S&P has struggled to move higher from around these current levels so many times in 2015, so the bulls will now need to chop some wood if we are to see fresh all-time highs soon. The immediate resistance levels to watch are at 2080, followed by a bearish trend line around 2100/10. The previous peak was formed around 2137 in May. On the downside, the above-mentioned moving averages could provide some support upon re-test. Failure to do so, could see the index head towards the next potential support at 2045 and if this level breaks down then a revisit of the key support area between 1995 and 2008 could be a possibility in early 2016.