S amp P 500 continues record rise
The S&P 500 (daily chart shown below) has continued its rise to progressively higher record levels, despite a market environment that many have deemed long […]
The S&P 500 (daily chart shown below) has continued its rise to progressively higher record levels, despite a market environment that many have deemed long […]
The S&P 500 (daily chart shown below) has continued its rise to progressively higher record levels, despite a market environment that many have deemed long overdue for a correction.
While the US equity markets have been entrenched in a bullish trend for over five years, the past two years have displayed a particularly strong and steady climb.
The benchmark index reached a new high of 1902 exactly two weeks ago, decisively answering the question asked repeatedly in the past several months – “Will the S&P see 1800 or 1900 first?”
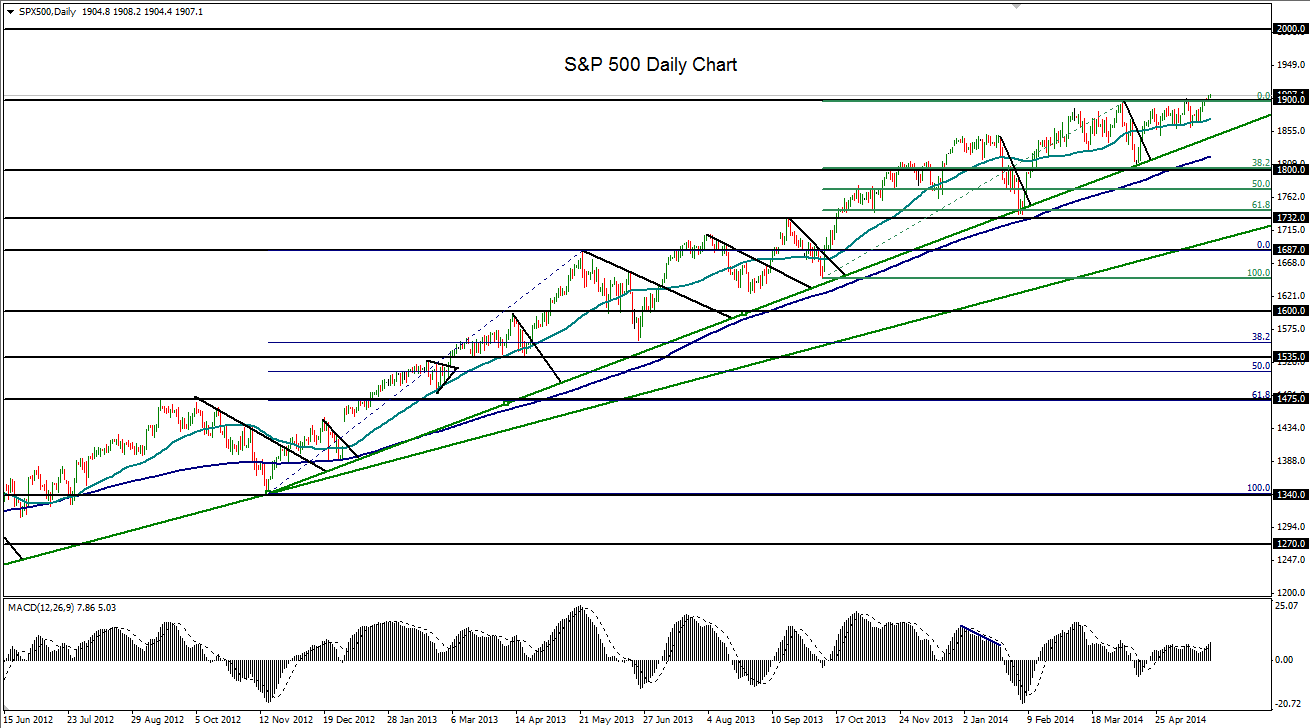
The last significant pullback within this bullish trend occurred during the first half of April, when the index fell by a mere 4% from its high at that time of 1897, far short of the 10% generally used to define a full correction. The last time a full correction actually took place was during April and May of 2012.
Last Friday’s price action saw a weekly close right on the 1900 mark, just short of the record high two weeks ago, while Tuesday morning has shown an early jump for the index.
If price action is able to stay afloat above 1900, the next major upside target in uncharted territory is the primary psychological level at 2000.
Short-term downside support on any subsequent pullback remains around the key 1850 level.
