S amp P 500 attempting recovery from 4 pullback
The S&P 500 index (daily chart shown below) has managed to regain well more than half of the 4% loss it experienced earlier in April […]
The S&P 500 index (daily chart shown below) has managed to regain well more than half of the 4% loss it experienced earlier in April […]
The S&P 500 index (daily chart shown below) has managed to regain well more than half of the 4% loss it experienced earlier in April when it pulled back sharply from the new record high of 1897 down to key support around the mid-April low of 1814.
In the process of this partial recovery, the US equity benchmark index has once again risen above its 50-day moving average.
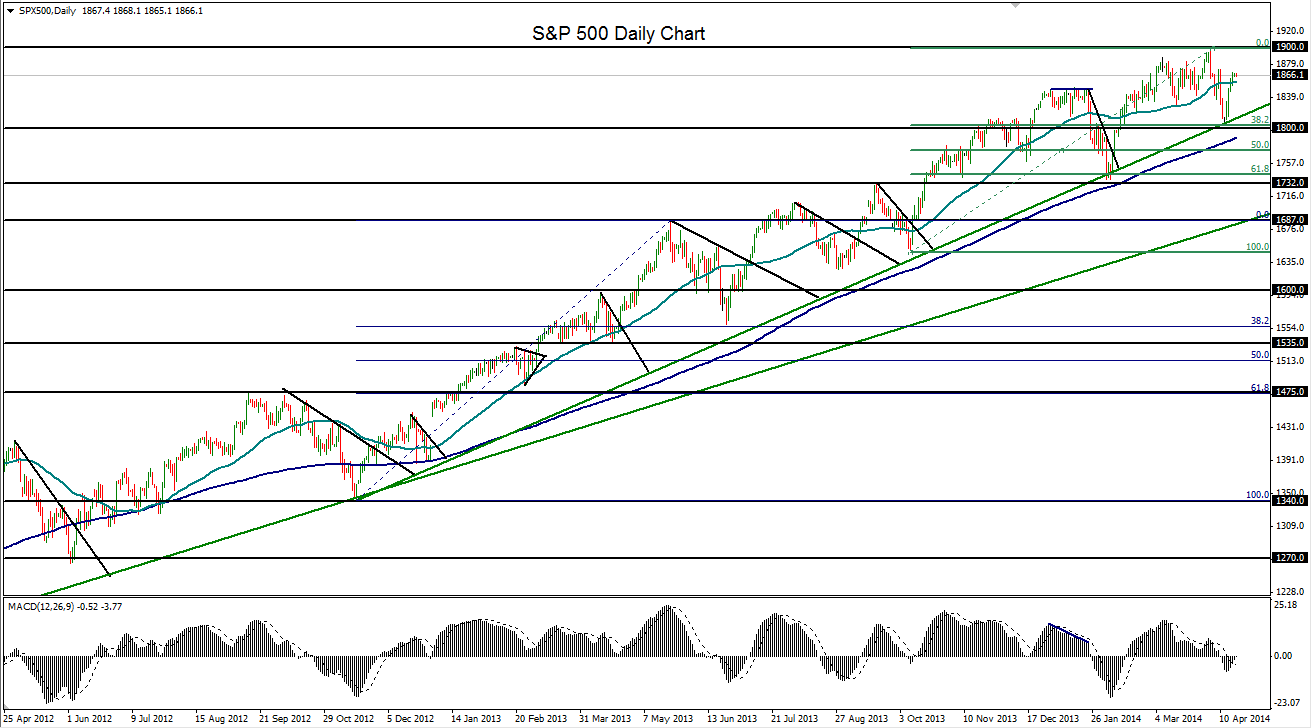
While momentum stocks fared significantly worse in April month-to-date, the overall equities market as measured by the S&P 500 has registered only a minor setback within the long-term bullish trend.
The last time that the index pulled back significantly was in late January, when it fell from a high of 1850 down to a low of 1737, for a larger 6% decline.
Having just rebounded from major support around the 1815 area early last week, the S&P 500 is on track to retest its record high and upside target around the 1900 psychological resistance level.
A further breakout above 1900 would confirm a continuation of the entrenched bullish trend, pushing the primary target up towards 2000.
Strong downside support continues to reside around the 1800-1815 support zone.
