S 038 P 500 stalls after pullback
The S&P 500 Index (daily chart) has stalled after pulling back to a key uptrend support line extending back almost two years to late 2012. […]
The S&P 500 Index (daily chart) has stalled after pulling back to a key uptrend support line extending back almost two years to late 2012. […]
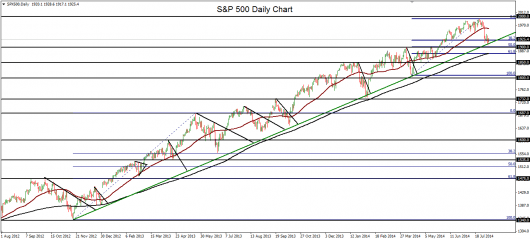
The S&P 500 Index (daily chart) has stalled after pulling back to a key uptrend support line extending back almost two years to late 2012. This pullback has brought the US equity index down sharply from its record high of around 1991 that was hit just two weeks ago in late July. That high fell just slightly short of the original upside target at 2000.
Now consolidating its recent decline just above the 1900 support level, the S&P 500 has currently taken somewhat of a neutral position, trading squarely between its 200-day moving average to the downside and its 50-day moving average to the upside.
Having assumed a directional pause for the time being after last week’s sharp decline, the question remains as to whether the long overdue correction is just around the corner, or if the index will once again recover and resume the long-term bullish trend that has been in place for at least the past five years.
To the downside, the key support level to watch remains nearby at the major 1900 level. Any significant breakdown below 1900 could provide the impetus for a more substantial pullback or correction, in which case the next major downside target resides around the 1850 support level.
To the upside, any strong return above the 1950 level and the 50-day moving average could indicate yet another recovery for the index, in which case the major upside target continues to reside around the noted 2000 level for a confirmed continuation of the long-term bullish trend.
