S 038 P 500 looks toppish below 2170 2180
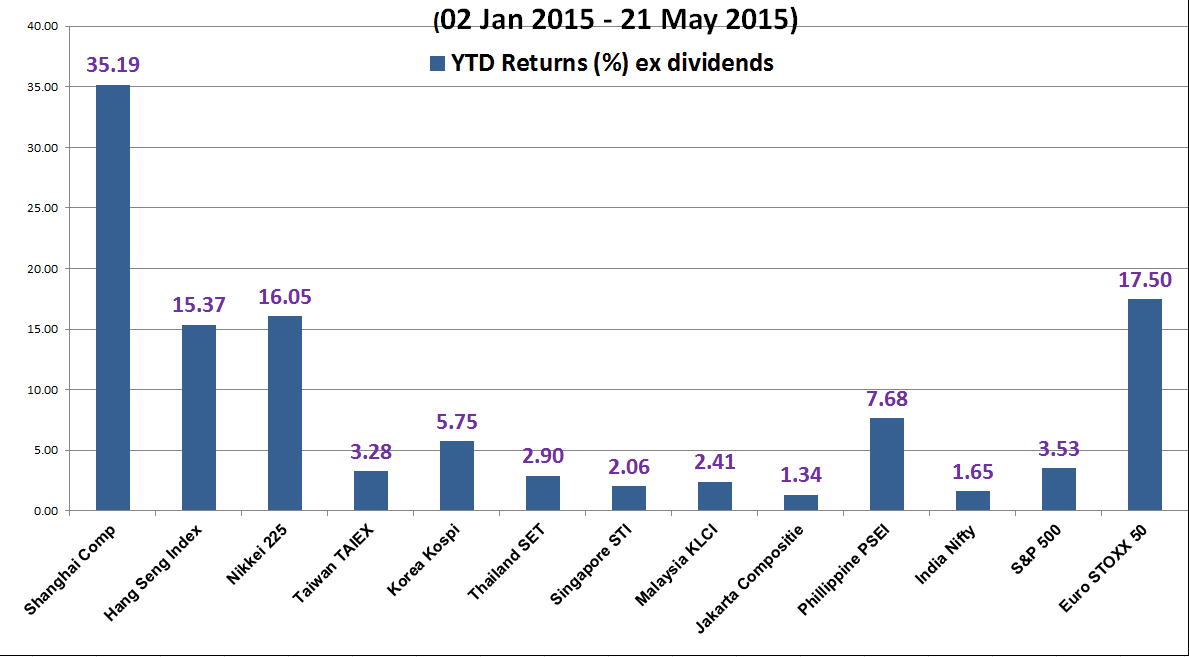
As seen from the year-to-date performance (ending 21 May 2015) of the major and Asian stock indices, the S&P 500 has recorded a lacklustre performance […]
As seen from the year-to-date performance (ending 21 May 2015) of the major and Asian stock indices, the S&P 500 has recorded a lacklustre performance […]
As seen from the year-to-date performance (ending 21 May 2015) of the major and Asian stock indices, the S&P 500 has recorded a lacklustre performance of 3.53%. This dismal performance of S&P 500 is way below its counterparts such as the Euro STOXX 50 (+17.50%), Nikkei 225 (+16.05%) and Shanghai Composite (+35.19%) despite its improving economic conditions versus Europe, Japan and China.
Let’s dissect the S&P 500 from a technical analysis perspective to gauge its future expected performance.
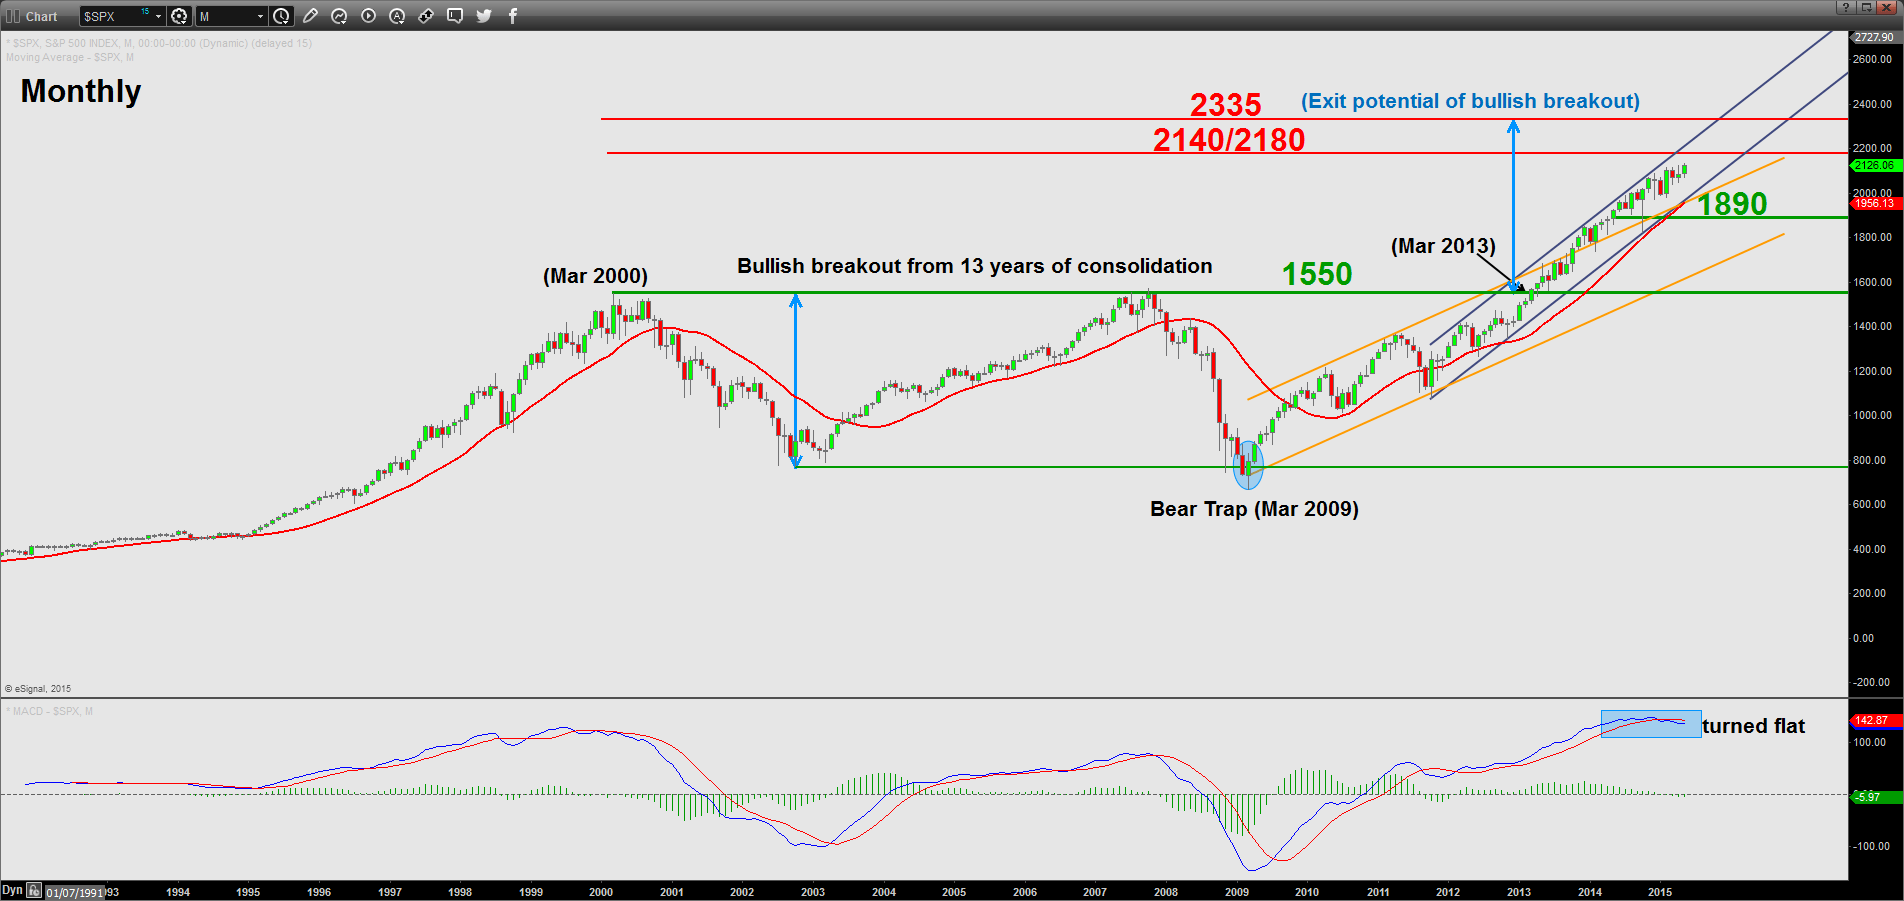
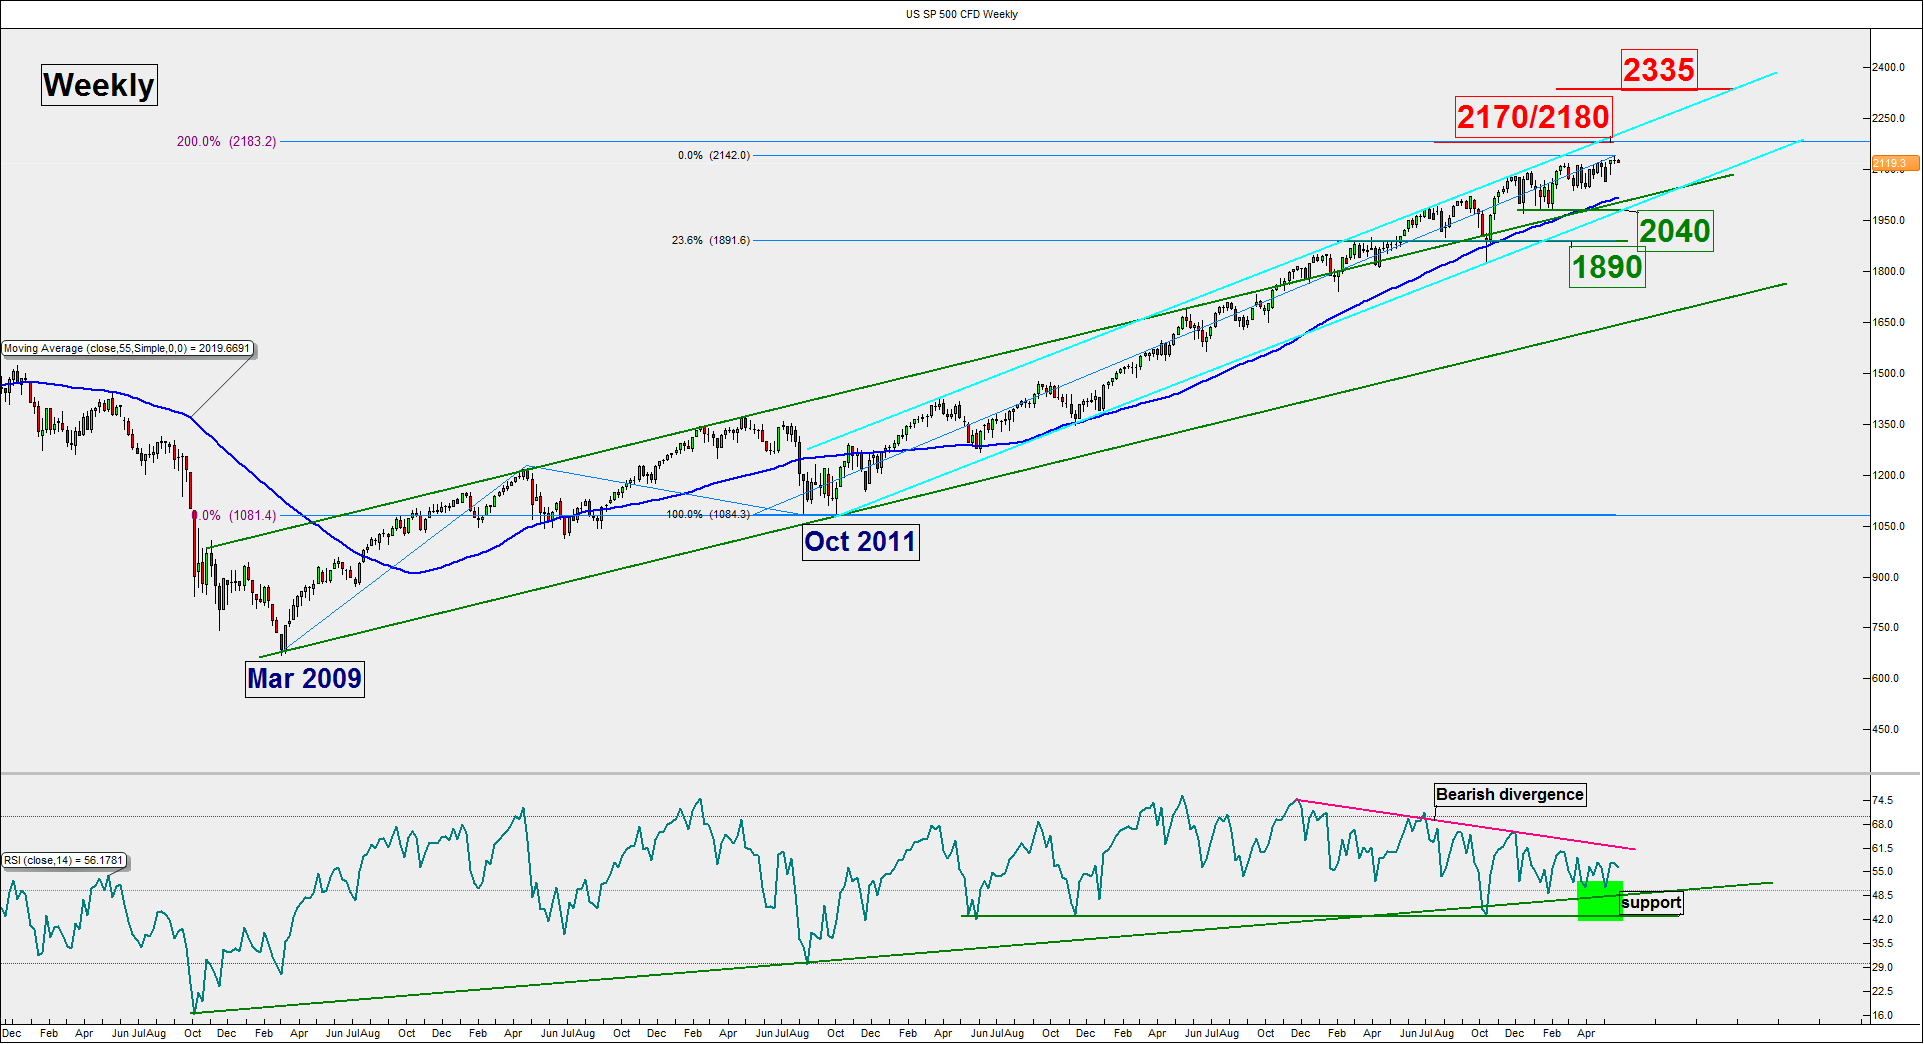
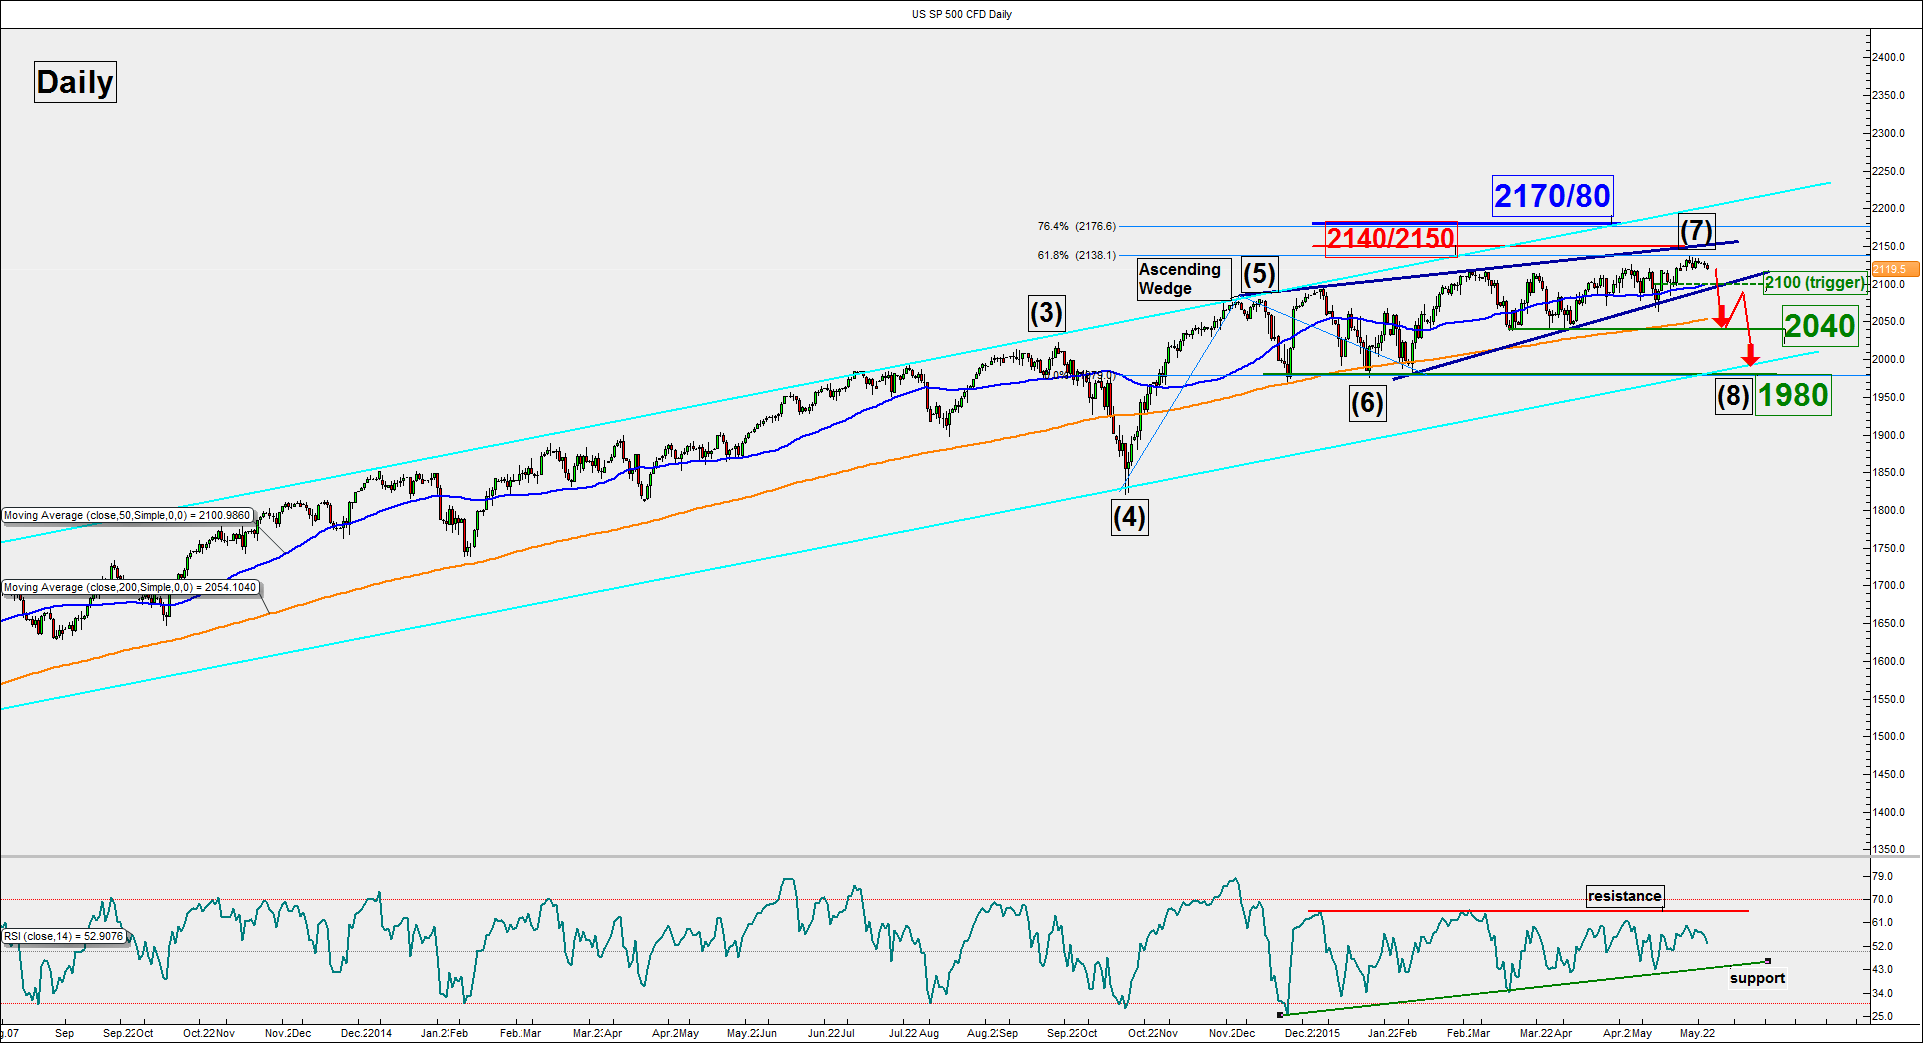
Chart 2:
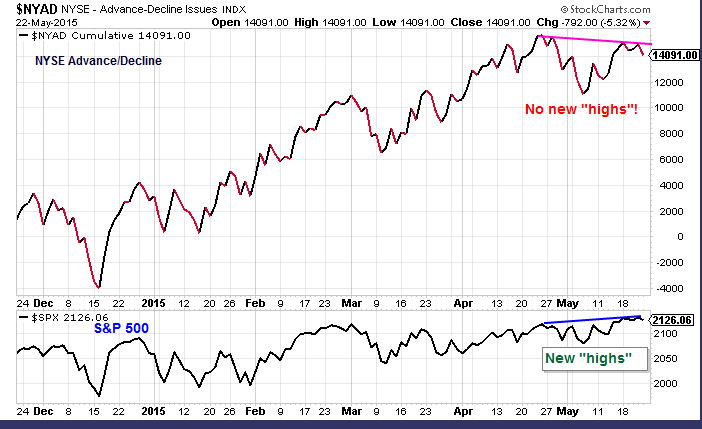
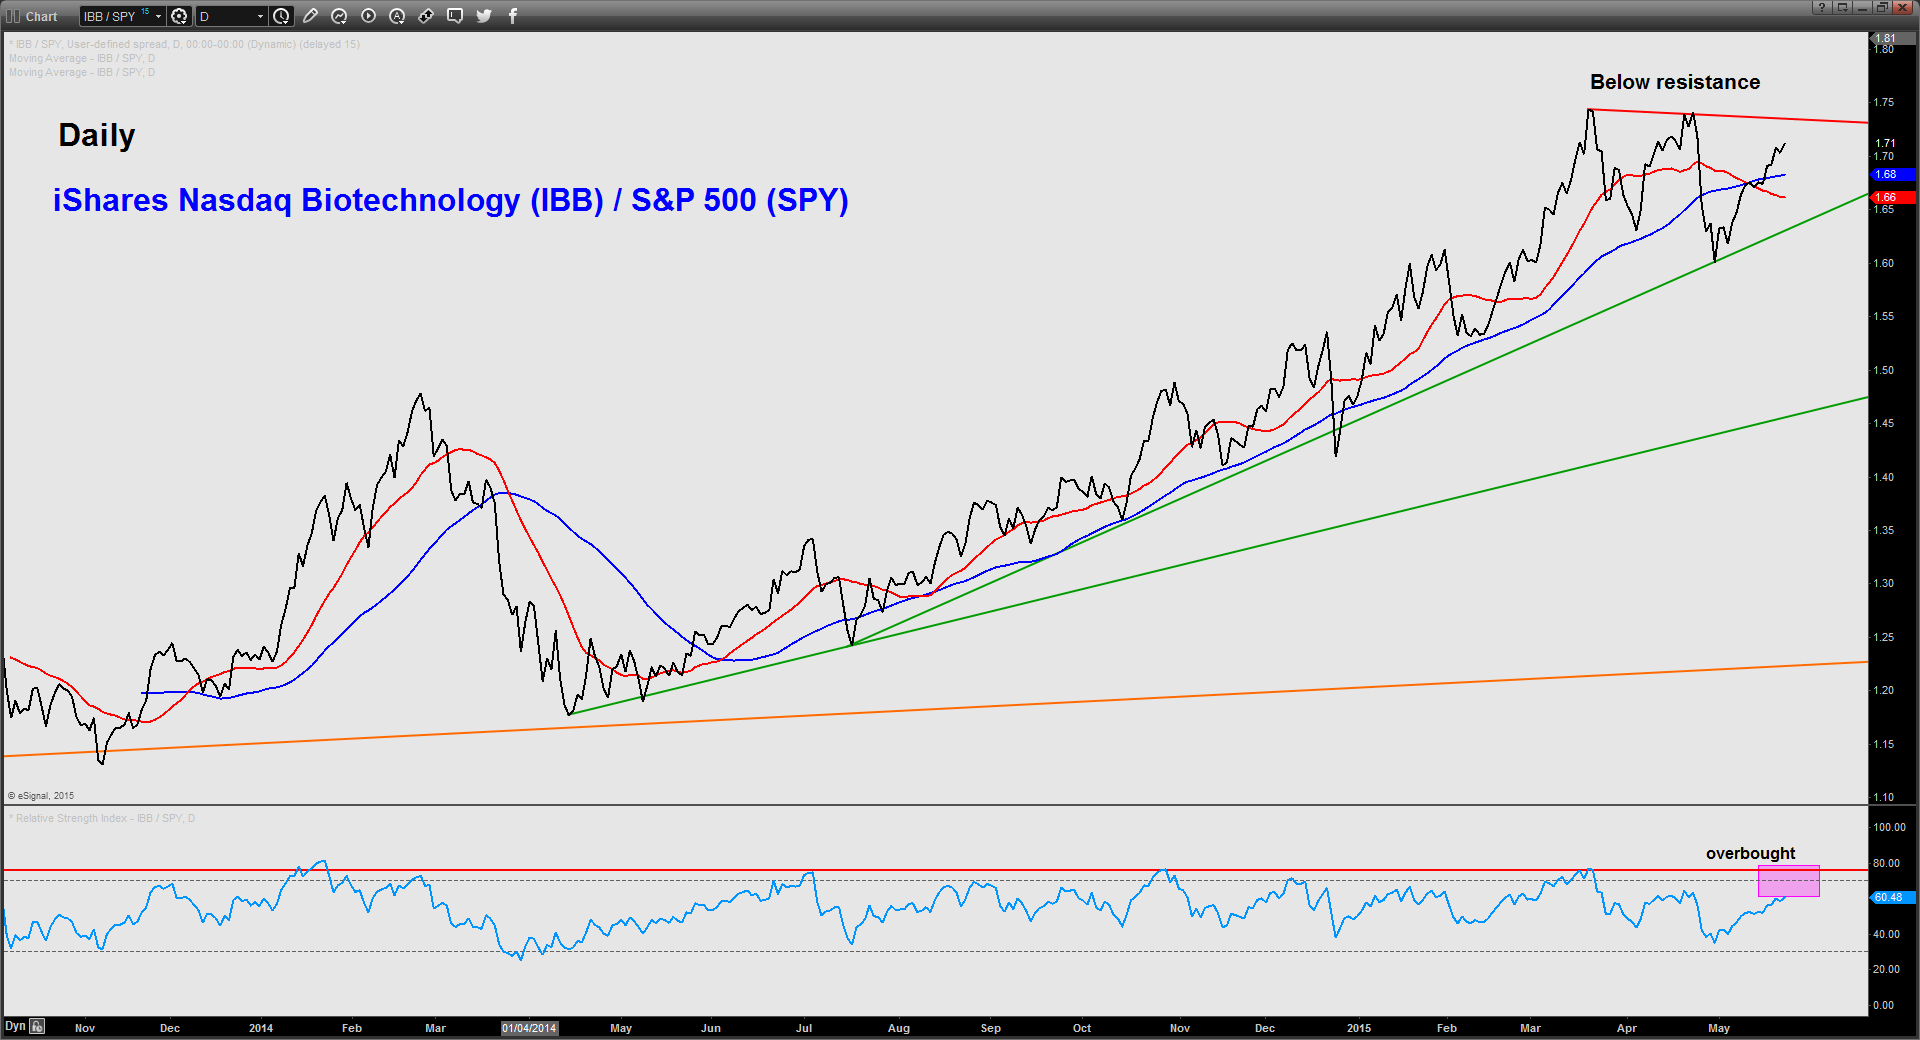
Chart 3:
Intermediate resistance: 2140/2150
Pivot (key resistance): 2170/2180
Support: 2100, 2040 & 1980
Next resistance: 2335
The S&P 500 (US SP 500) is coming close to a key inflection level of 2140/2150 with deteriorating technical elements. As long as the 2170/2180 pivotal resistance is not surpassed, the Index faces the risk of a significant “min correction” of 5% to 6%. A break below 2100 is likely to add impetus for this potential steep decline towards 2040 before 1980. Do note that the long-term bullish trend is still intact (see monthly chart above).
On the other hand, a clearance above 2180 is likely to invalidate the bearish view to open up scope for a multi-month upside movement to target the next resistance at 2335.
