S 038 P 500 hits new record high above 2000
The S&P 500 index (daily chart show below) on Tuesday hit a new record high above 2000, which was its long-awaited upside target and a […]
The S&P 500 index (daily chart show below) on Tuesday hit a new record high above 2000, which was its long-awaited upside target and a […]
The S&P 500 index (daily chart show below) on Tuesday hit a new record high above 2000, which was its long-awaited upside target and a major psychological resistance level. A high around 2005 was reached in Tuesday’s trading before the index pulled back down to close around 2000.
This new all-time high surpassed the high of 1991 that was reached slightly more than a month ago in late July, tentatively confirming a continuation of the exceptionally strong bullish trend that has been in place for more than five years since the index bottomed out in March of 2009.
The rise above 2000 occurs in the midst of a steeply bullish, one-directional run that saw the S&P 500 rebound and recover within the past three weeks from a relatively shallow pullback to around the 1900 support level in early August. That support level, incidentally, was also around the area of the 100-day moving average.
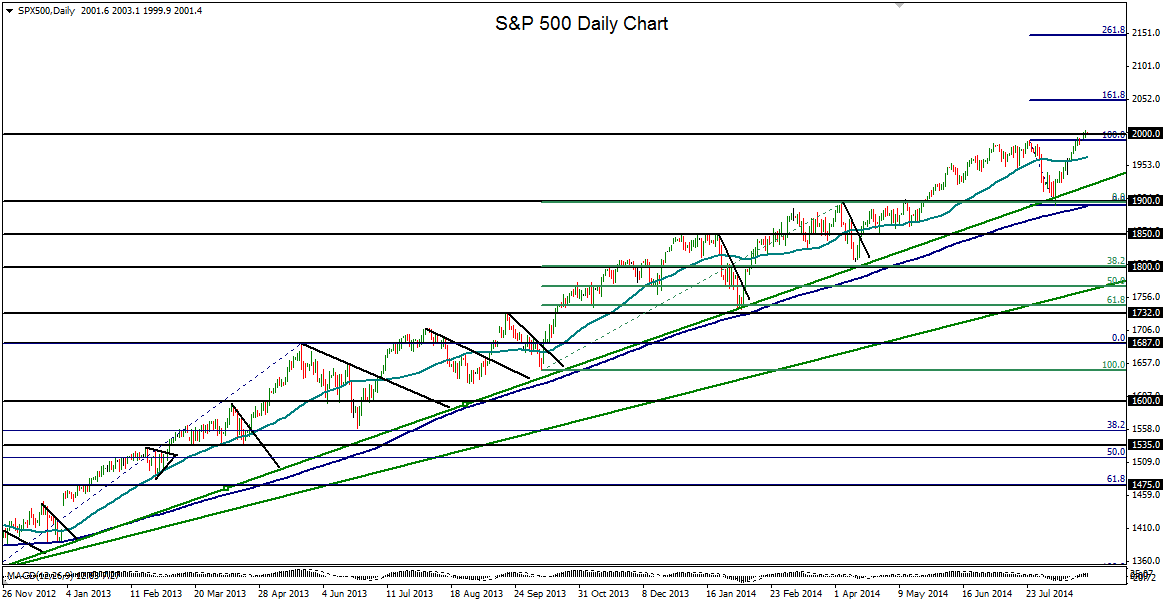
Having now risen well above its 50-day moving average in addition to its prior record high, the index continues to ignite and magnify speculation of a potentially stronger pullback or impending correction from its currently over-extended highs.
Major support in the event of another pullback continues to reside at the 1900 level.
In the event of continued advances, Fibonacci extension levels from the last pullback place further upside targets, in the absence of any historical price precedent, around 2050 (161.8% extension) followed by 2150 (261.8% extension).
