Russell 2000 US stocks attempt to form near term base
The US stock markets have been trying to stabilise in recent times following the wobble at the start of the year. Though concerns over the […]
The US stock markets have been trying to stabilise in recent times following the wobble at the start of the year. Though concerns over the […]
The US stock markets have been trying to stabilise in recent times following the wobble at the start of the year. Though concerns over the global economy are still there, sentiment has turned slightly positive after the major global central banks either expanded their unconventional policy tools or promised to do so, or in the case of the Fed and BoE, dropped their previously hawkish tone. Fourth quarter earnings results have not been too bad but not great either with Facebook for example doing particularly well and Netflix not so great. All in all we are not out of the woods just yet, but there is a possibility for a short-term recovery from these depressed levels. At least that’s what the charts are pointing to, anyway.
More on that below, but the rebounding prices of oil and metals have also provided some support to commodity stocks. With regards to oil, there is lots of uncertainty still hanging over the market and traders are getting used to wild daily price swings in and around the $30 area. Essentially, we have seen tentative signs that the buyers are stepping back in but because there has been no confirmation of a change in the trend yet, they are rightly being nimble. And it is pretty much a similar story for the stock markets – lots of choppy price action as both the bulls and bears battle for control, but no clear winner.
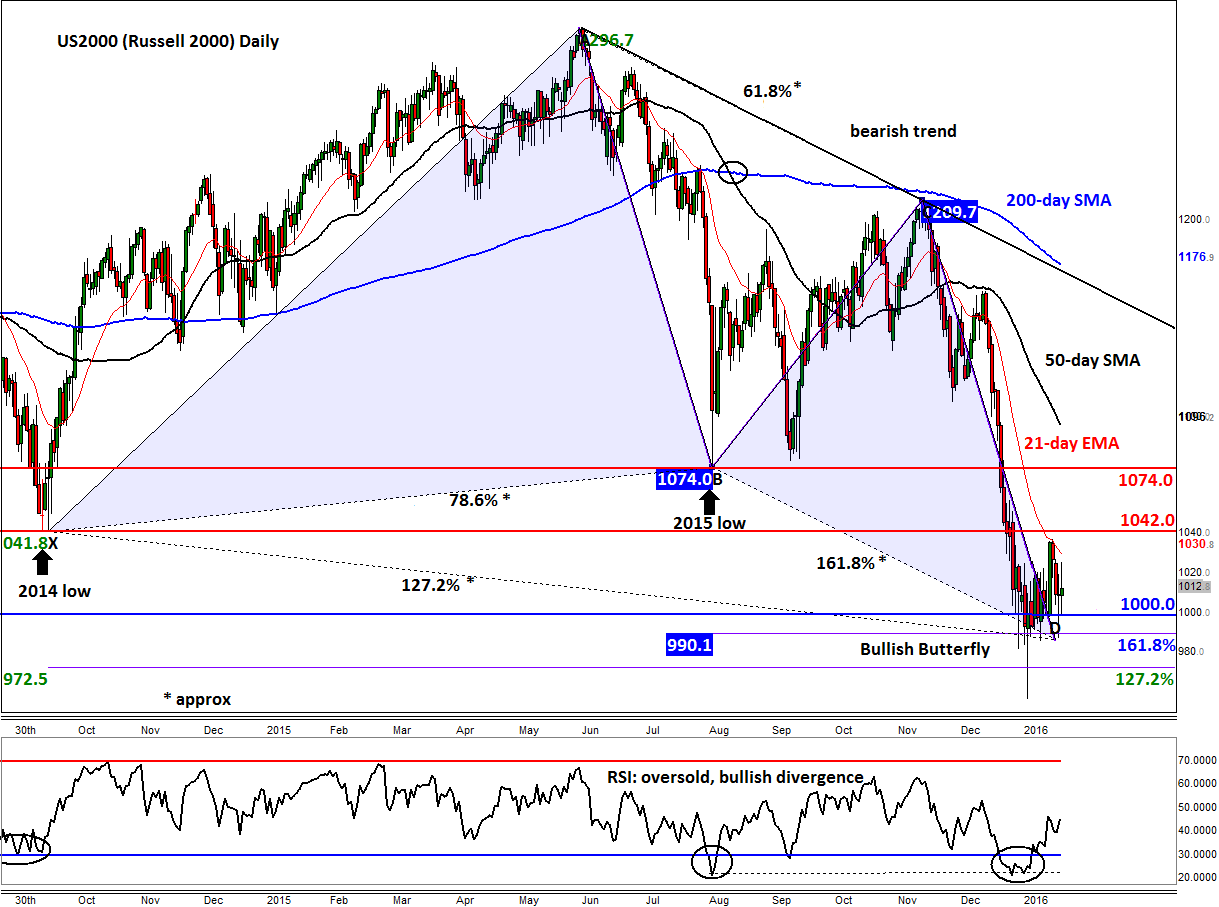
But as can be seen from the daily chart of the Russell 2000, below, even small-cap US stocks are trying to regain their poise. The index is attempting to find a base around the psychologically-important 1000 level; here it has formed several bullish-looking candlestick formations in recent days, but as mentioned with very little follow-through in the buying pressure. The convergence of two Fibonacci extension levels from as many price swings around the point D of an ABCD price pattern means there’s also a bullish Butterfly formation in the making around these levels. This, combined with the RSI’s bullish divergence with the index is suggesting that at the very least the index is due for an oversold bounce – if we haven’t already seen one, that is.
If the Russell does manage to bounce, it will still need to clear some important resistance levels that are now looming large at 1040/2 and then the 1074/5 area. These are the respective low points from 2014 and 2015. Bullish traders should therefore remain nimble. Indeed, it could be that some speculators may well be waiting to sell once the markets stage a more profound recovery, now that the longer-term technical outlook is clearly bearish. Meanwhile, a potential closing break below the 161.8% extension level of the BC swing at 990 would be a bearish development. If this were to happen, we could see some further sharp drops before the buyers try to make another attempt at forming a base.