


The outcome on the “Super Saturday” U.K parliamentary vote is not in favour for PM Boris Johnson where lawmakers in the House of Commons have voted to postpone on whether to back the latest Brexit deal until legislation to implement the agreement has been passed.
Due to a recent passed legislation, PM Johnson has formally sent an unsigned letter to European Union to seek a request to delay Brexit until 31 Jan 2020 together with another letter to EU signed by PM Johnson with arguments that justify a further delay beyond 31 Oct 2019 is not in the best interest of U.K and EU. Despite his latest defeat in parliament, PM Johnson seems not to be backing down from his rhetoric for U.K to leave EU on 31 Oct even without a deal.
Right now, the finale will be a cliff-hanger as EU officials will now decide whether to grant an extended Brexit deadline to “kick the can further down the road” and also more gyrations in the U.K parliament as PM Johnson wants to make another attempt on Mon to get lawmakers to sign off on the principal of his latest Brexit deal but time is running short for Johnson.
Meanwhile, China’s top trade negotiator, Vice Premier Liu He has confirmed that Phase One of the U.S.-China trade deal is in progress and both sides have made substantial progress to lay an important foundation for an agreement. Liu He’s remarks were made at technology conference on Saturday. Recalled that after the recent U.S.-China trade negotiation talk concluded on 11 Oct, China’s media had painted a lukewarm picture and even omit the word “deal” in their coverage.
Thus, Vice Premier Lui He’s latest remarks can be construed that “some sort of deal” is in the pipeline from an official standpoint which can drum up the “trade deal optimism” feedback loop when markets open on Mon, Asian session that may thaw the “risk off” effect from a chaotic Brexit for now at least in the short-term.
Let’s us now take a look at the GBP/USD and the “risk sensitive” USD/JPY from a technical analysis perspective.
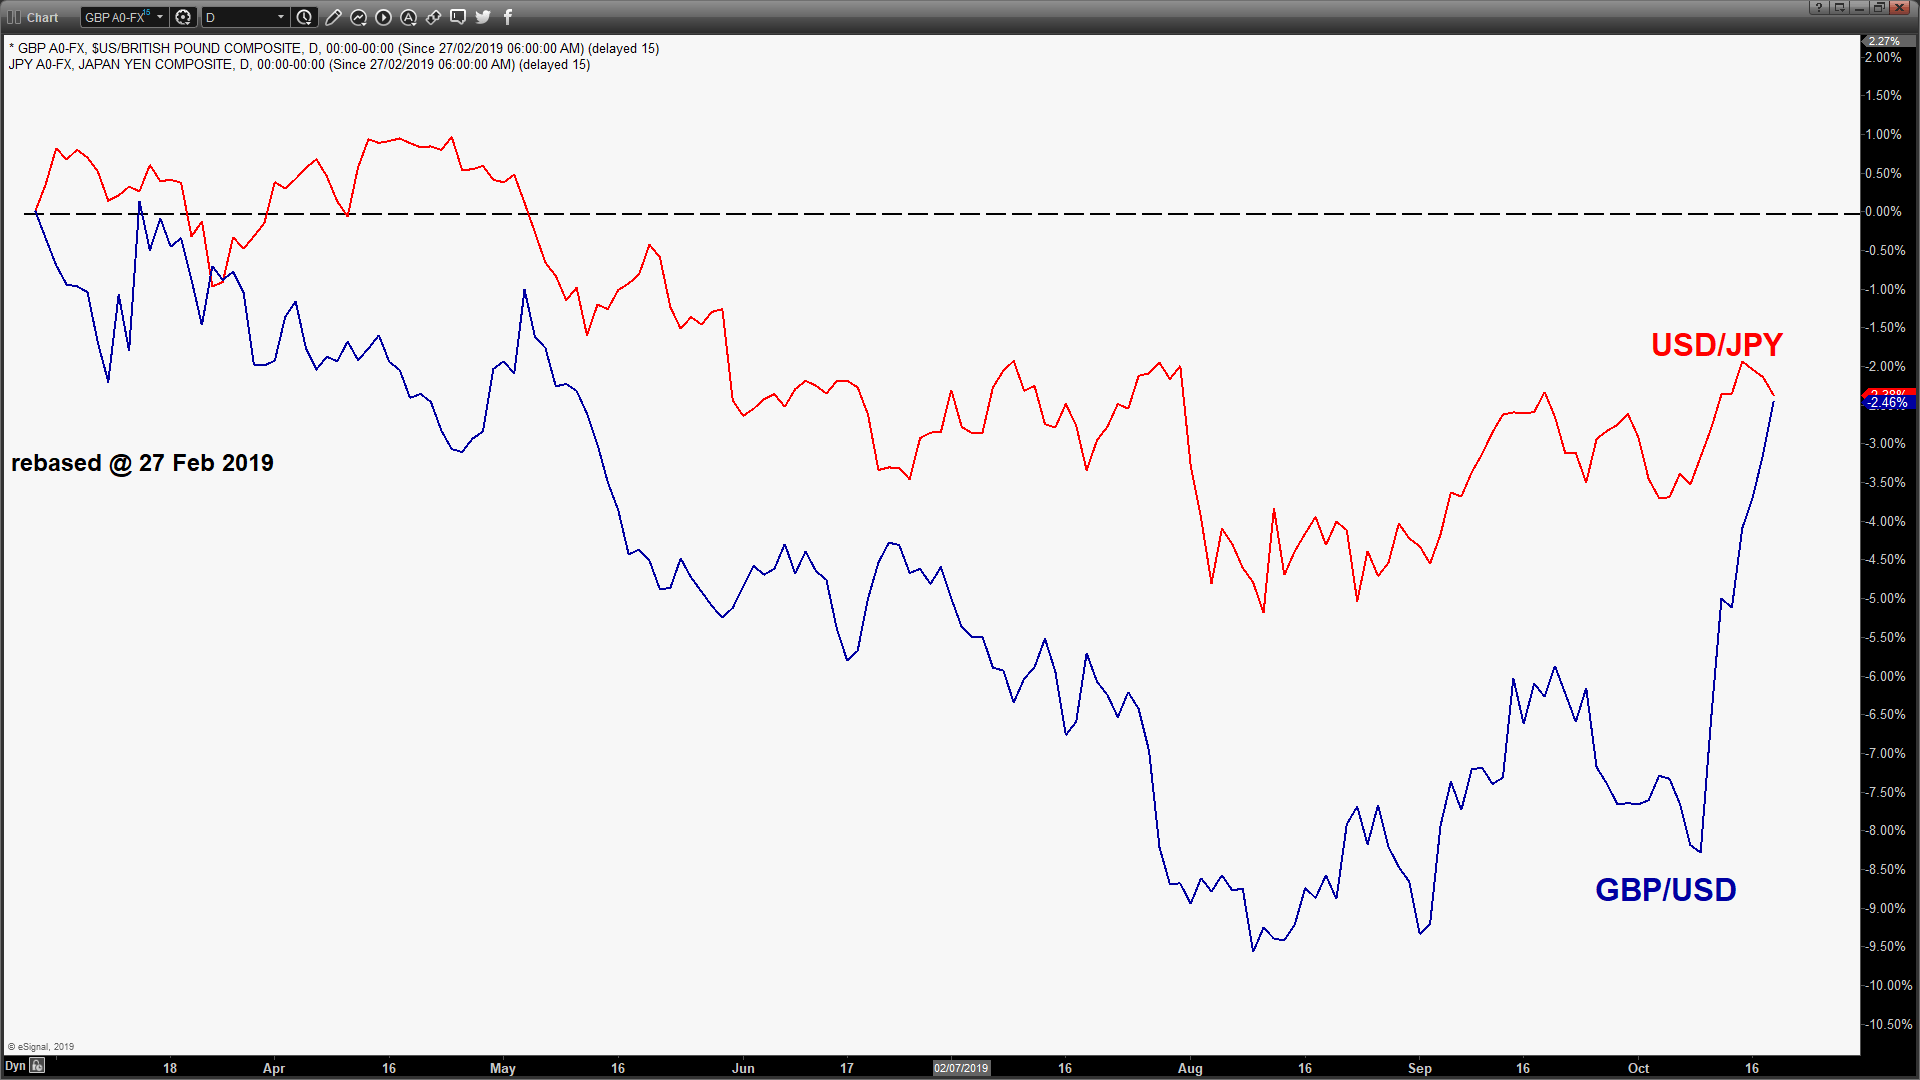
GBP/USD & USD/JPY in “lockstep” for the past 8 months
GBP/USD – Short-term uptrend remains intact
click to enlarge charts
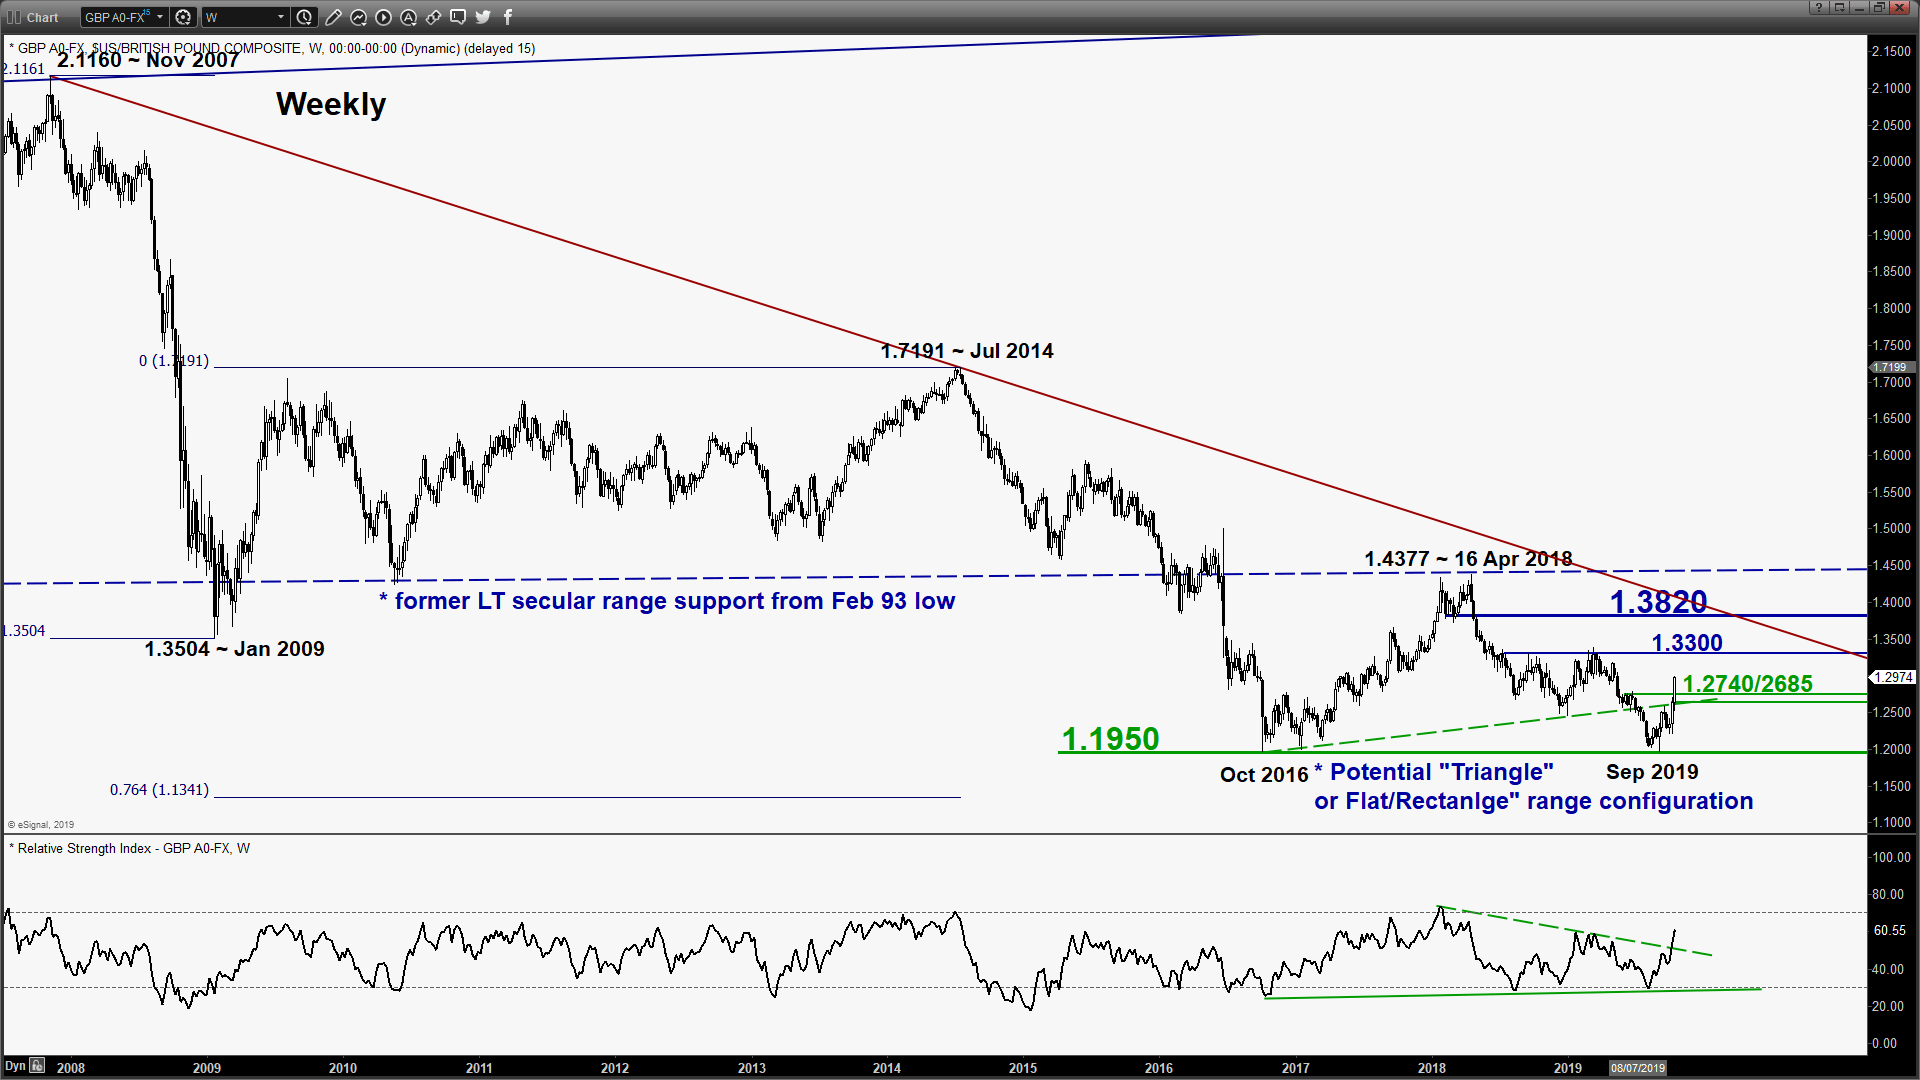
Longer-term horizon (1 – 3 months)
- Since its Oct 2016 swing low area, the pair is likely to be evolving in a major potential “Triangle” or “Flat/Rectangle” range configuration. The “Triangle” range resistance at 1.3820 (76.4% Fibonacci retracement of the decline from 16 Apr 2018 high to Sep 2019 low & the descending trendline from Nov 2007 high) while the “Flat/Rectangle” range resistance stands at 1.4240/4350 (refer to weekly chart).
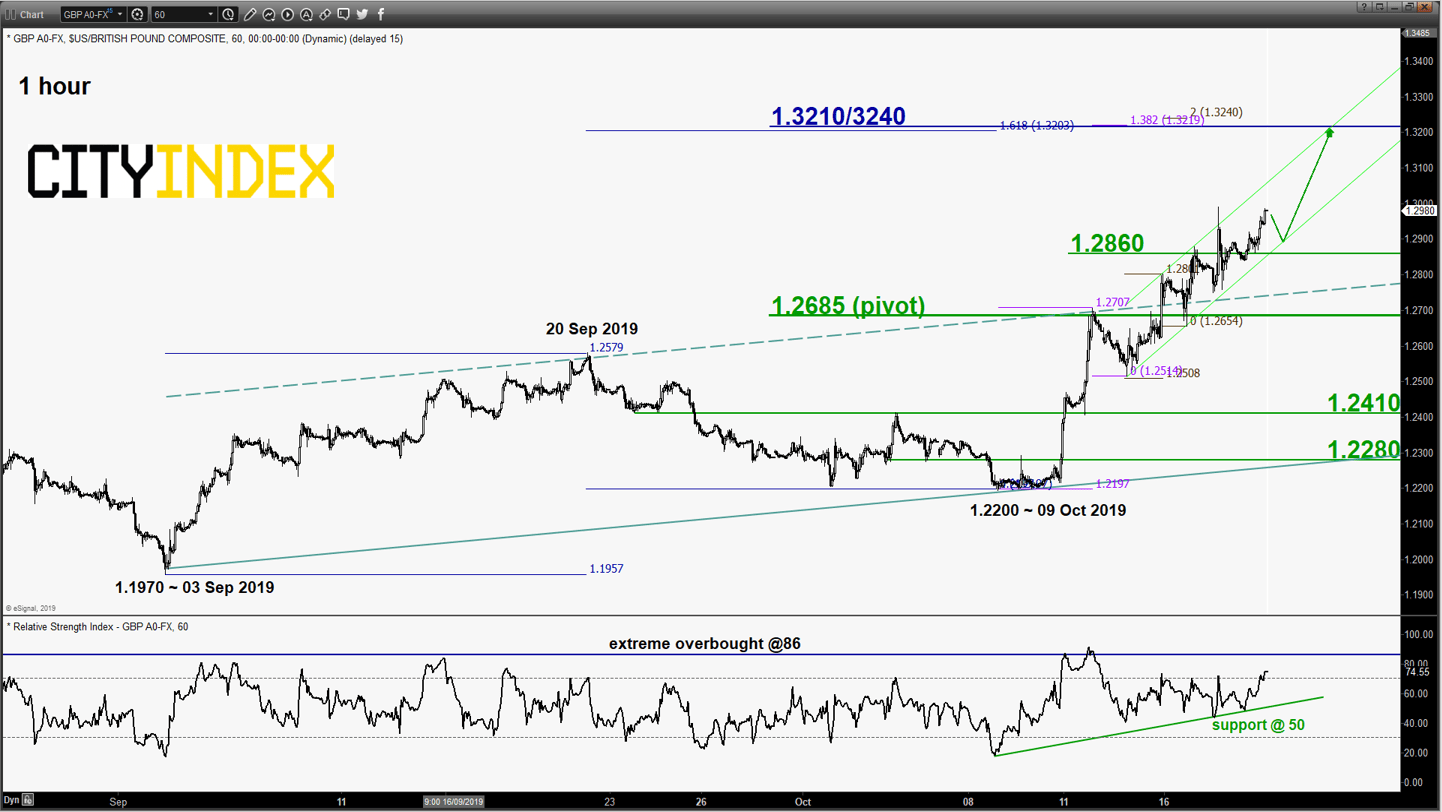
Shorter-term horizon (1-3 days)
- The pair has staged a bullish breakout above the upper boundary of a minor ascending channel in place since 03 Sep 2019 low on 15 Oct 2019 which indicates an acceleration of its minor uptrend.
- The hourly RSI oscillator is hovering at the overbought region but without any bearish divergence signal. Given its recent short-term overbought reading, the pair may gap down considering Sat’s Brexit vote outcome to the 1.2860 intermediate support (the lower boundary of the bullish breakout minor ascending channel from 14 Oct 2019 low). Fri, 18 Oct U.S. session closed at 1.2980.
- If the 1.2685 key short-term pivotal support holds, the pair is likely to resume its upleg to target the next intermediate resistance at 1.3210/3240 (upper boundary of the bullish breakout minor ascending channel & Fibonacci expansion cluster).
- However, an hourly close below 1.2685 invalidates the recent bullish breakout for a choppy slide towards the next support at 1.2410/2280.
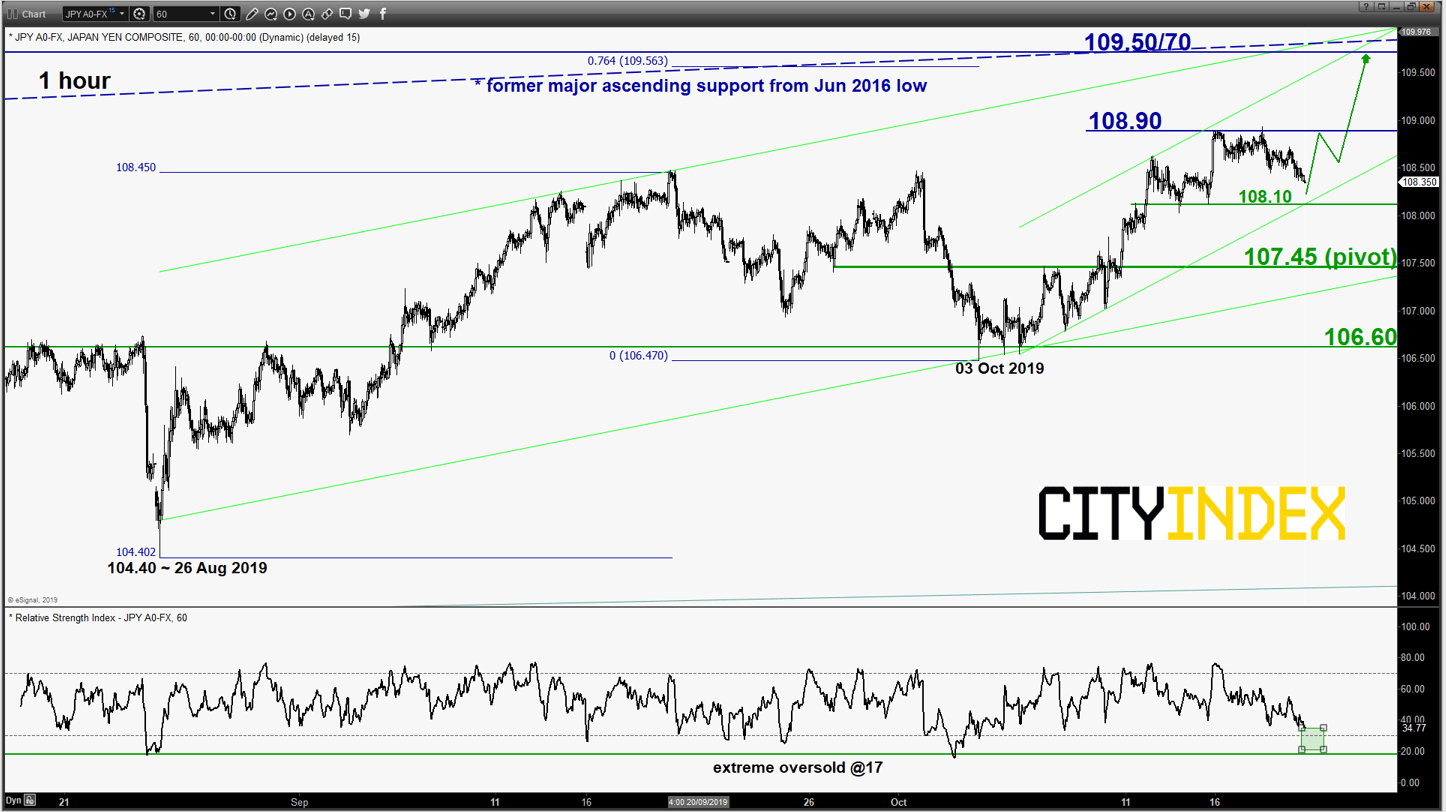
USD/JPY – Residual push up towards major resistance
click to enlarge charts
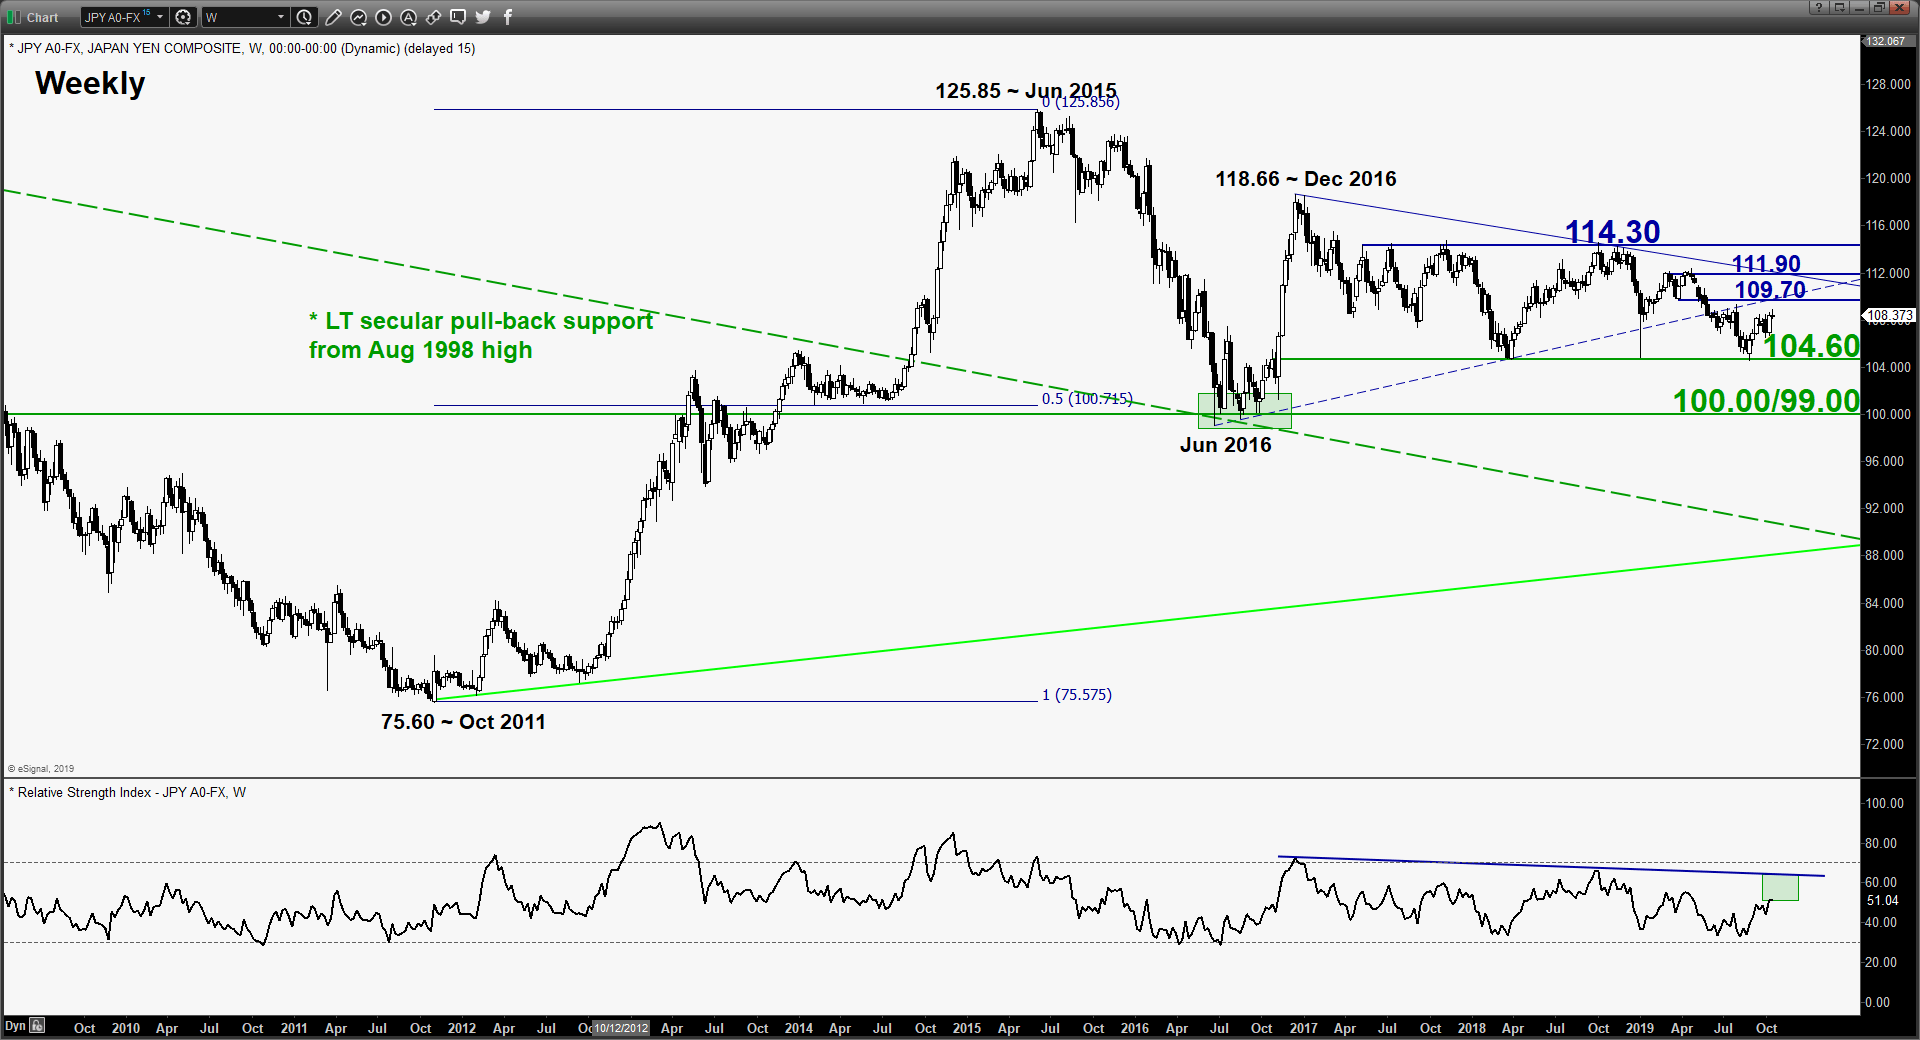
Longer-term horizon (1 – 3 months)
- Since its Dec 2016 high of 118.66, the pair has been evolving within a complex sideways range configuration with range resistance/support at 114.30 and 100.00/99.00 respectively (refer to weekly chart).
Shorter-term horizon (1-3 days)
- Since its 26 Aug 2019 low of 104.40, it has been evolving within a minor ascending channel with its upper limit/resistance at 109.50/70 that also confluences with the 0.764 Fibonacci projection of the recent up move from 26 Aug low to 19 Sep high projected from 03 Oct 2019 low and the former major ascending support from Jun 2016 low.
- From its 16/17 Oct 2019 minor swing high of 108.90, the pair has pull-backed by 55 pips with the current price action based on Fri, 18 Oct U.S. session close that is hovering just above a near-term support at 108.10. In addition, the hourly RSI oscillator has now dipped back towards its oversold region which suggests that the pair may have completed its pull-back from 16/17 Oct 2019 high.
- If the 107.45 key short-term pivotal support holds (also the 61.8% Fibonacci retracement of the recent push up from 03 Oct low to 17 Oct 2019 high), the pair is likely to resume its upleg to retest the 108.90 intermediate resistance before targeting the 109.50/70 major resistance (also the 0.764 Fibonacci expansion of the up move from 26 Aug low to 19 Sep 2019 high projected from 03 Oct 2019 low).
- However, an hourly close below 107.45 invalidates the bullish scenario for a deeper slide towards the next support at 106.60
Charts are from eSignal
Latest market news
Yesterday 03:30 PM
Yesterday 01:23 PM
Yesterday 11:00 AM
Yesterday 08:15 AM
Latest GBP articles
April 3, 2024 02:49 AM
March 29, 2024 10:00 PM
March 9, 2024 04:00 PM
October 24, 2023 02:20 AM