Risk of a pull back for Hang Seng 40 above 27300 26900 before more upside
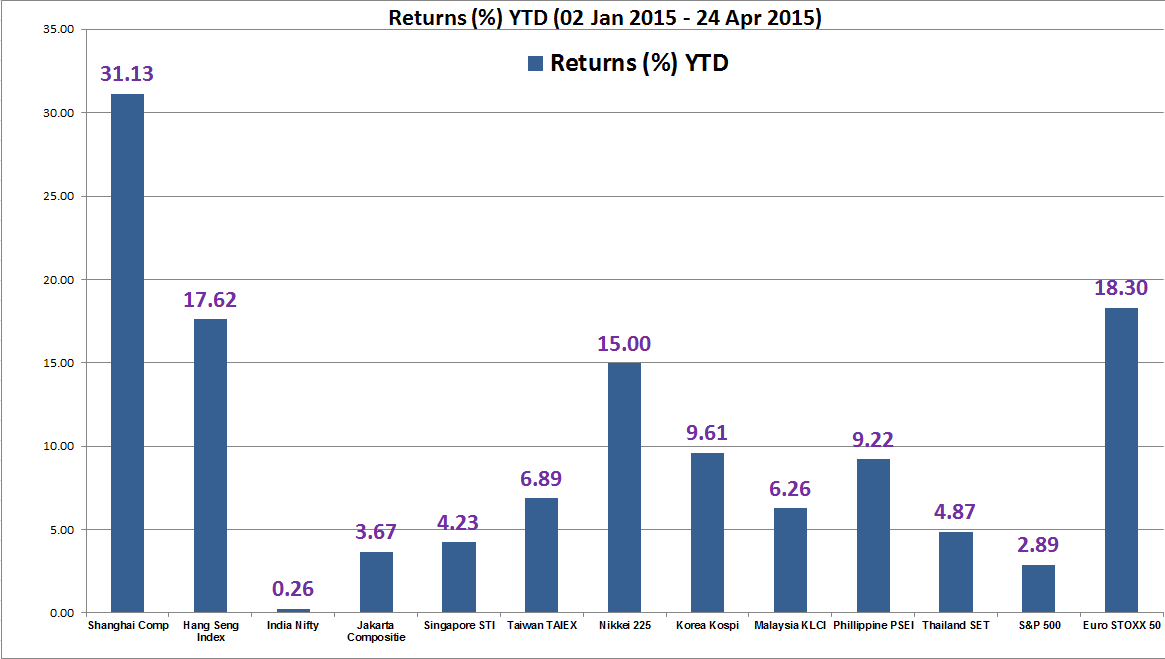
Hong Kong is the second best performing Asian stock market as her benchmark Hang Seng Index soared by 17% year to date (as at 24 […]
Hong Kong is the second best performing Asian stock market as her benchmark Hang Seng Index soared by 17% year to date (as at 24 […]
Hong Kong is the second best performing Asian stock market as her benchmark Hang Seng Index soared by 17% year to date (as at 24 April 2015) just behind the “red hot” Shanghai Composite Index (see performance chart below).
Most of the gain seen in the Hang Seng Index has been attributed in the month of April 2015 and a jump in liquidity from the Shanghai-Hong Kong Stock Connect program (a catch up play in terms of performance after lagging behind the Shanghai Composite since last year).
Let us take a look at its technical elements to decipher its expected performance going forward.
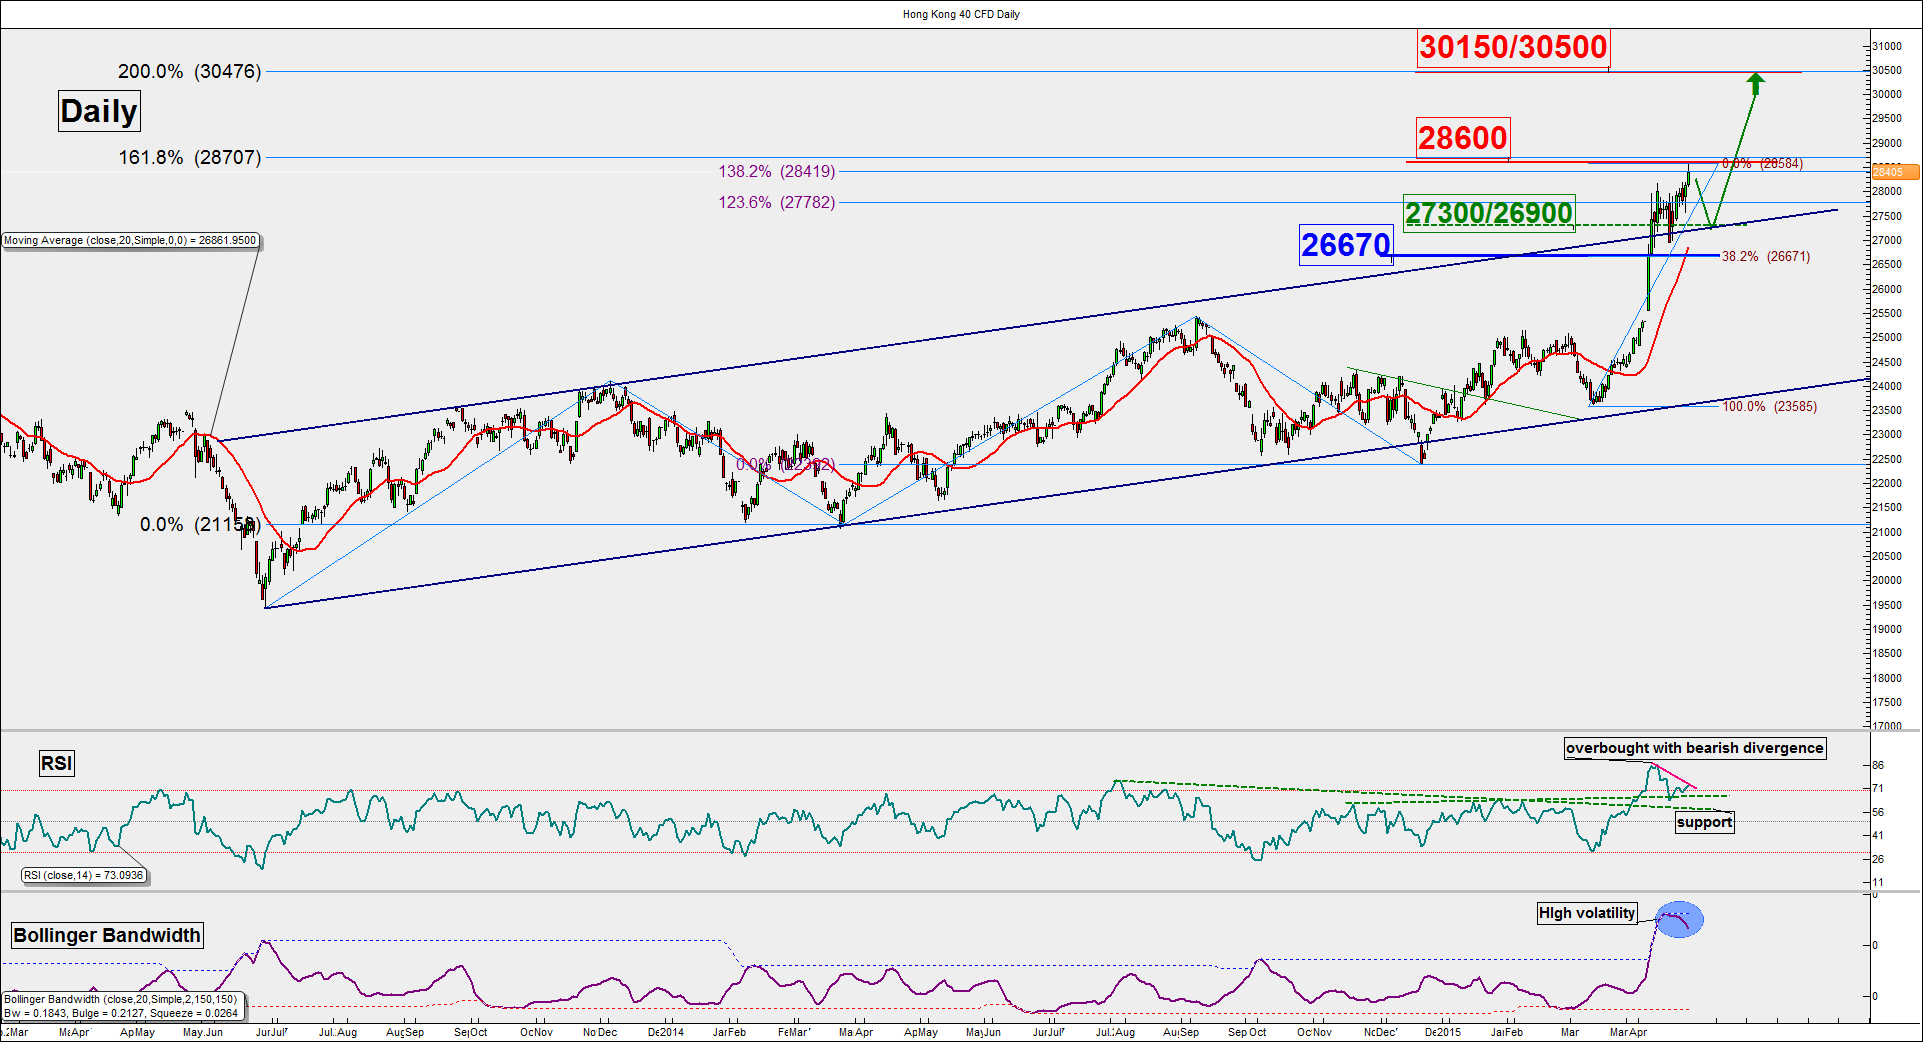
Intermediate support: 27300/26900
Pivot (key support):26670
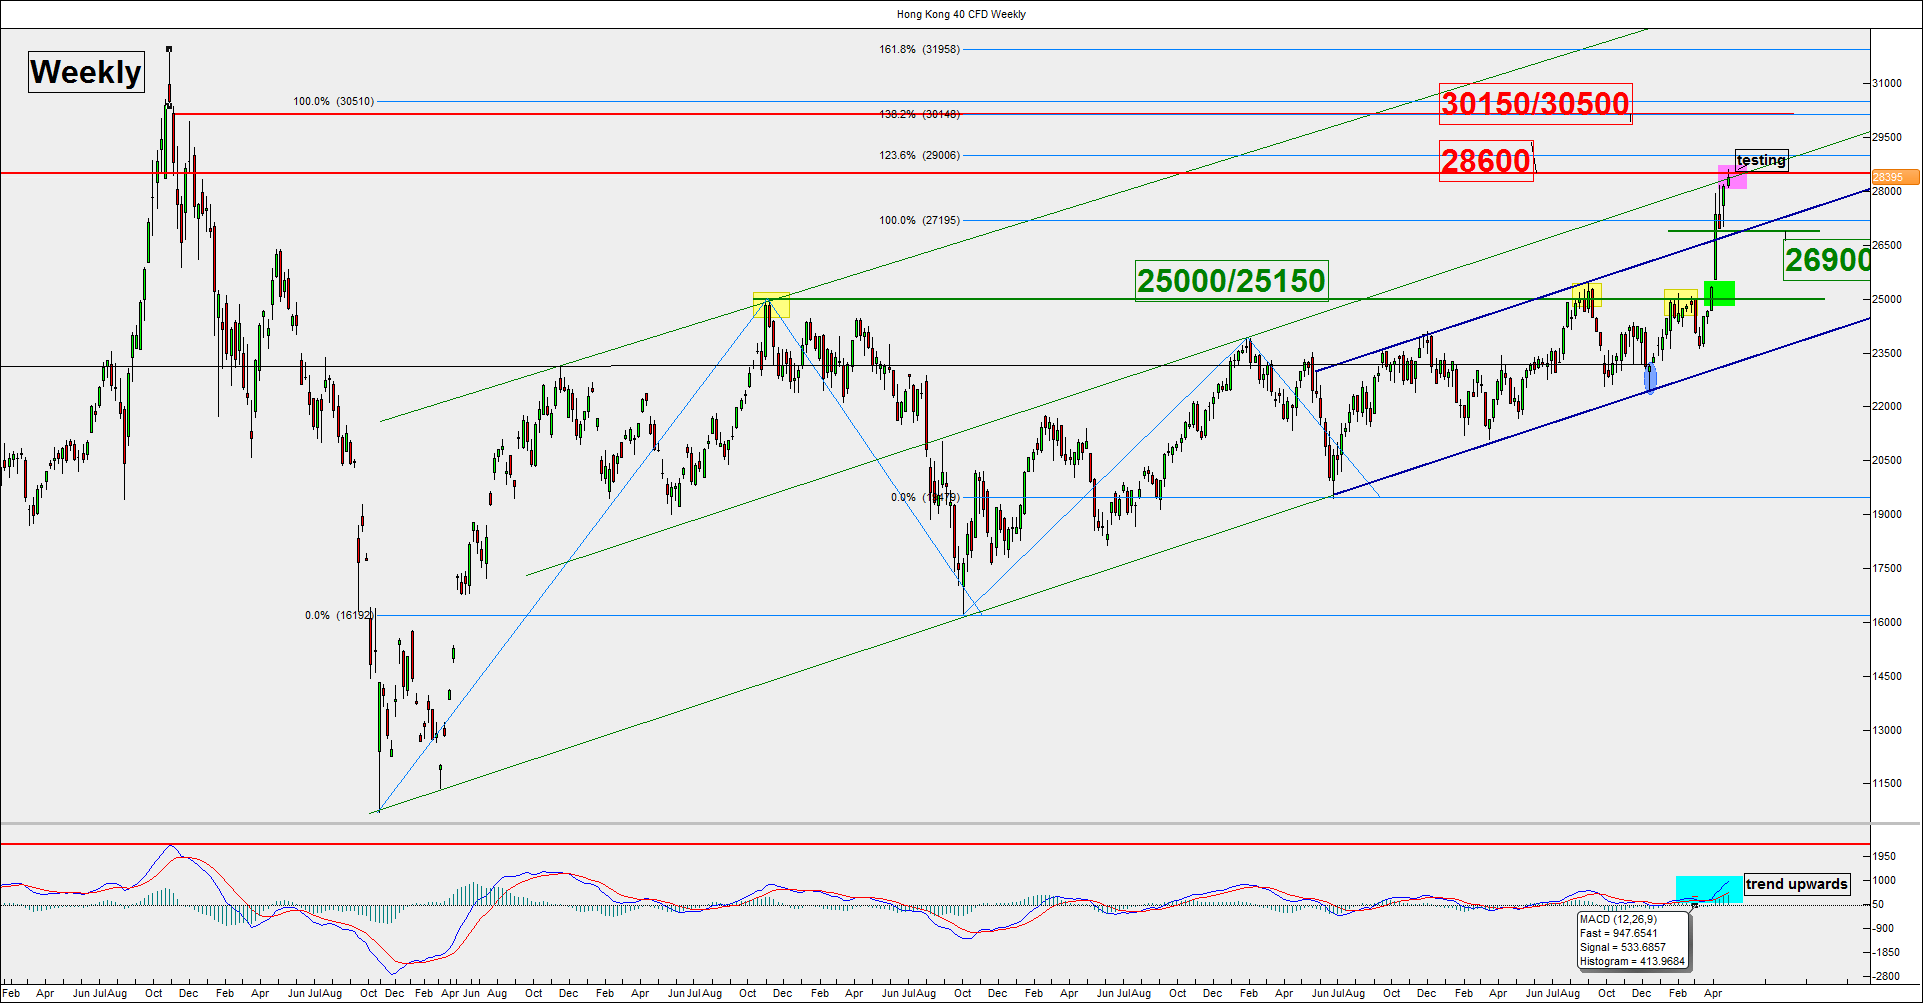
Resistance: 30150 & 30500
Next support: 25150/25000
Intermediate term mathematical indicators (Bollinger Bandwidth & RSI oscillator) as seen on the daily chart highlights the risk of a pull-back first towards 27300/26900.
As long as the 26670 monthly pivotal support holds, the Index is likely to see another round of potential upside movement to resume its multi-month bullish trend to target 30150 before 30500.
On the other hand, failure to hold above 26670 may damage the multi-month bullish trend for a deeper decline towards the long-term significant support at 25150/25000 (former resistance that capped the Index since October 2010).
