Rio BHP shares hit critical juncture amid iron ore price war
A price war amongst the UK’s iron ore producing giants has pushed their shares to an important juncture this week. With the collapse in the […]
A price war amongst the UK’s iron ore producing giants has pushed their shares to an important juncture this week. With the collapse in the […]
A price war amongst the UK’s iron ore producing giants has pushed their shares to an important juncture this week.
With the collapse in the price of iron ore now well-entrenched, having been in effect for more than three years, and benchmarks having fallen to five-year lows, stocks of BHP Billiton and Rio Tinto are now sitting on important pivot points, beyond which may lie significant downside.
It comes as the price of the most widely used grade of the mineral, known as 62% iron ore, reaches a five-year low, after tumbling from highs close to $190 a tonne in February 2011 to $70 on Thursday.
The main weight on prices remains a rise in supply that is outstripping demand from China, the world’s top buyer of the commodity used to make steel.
Continuing signs of weakness in China’s property sector are spurring a decline in steel and iron ore prices amid additional indications of slower global economic growth.
Despite all these factors, Brazil’s Vale S.A., Rio Tinto and BHP Billiton, respectively the first, second and third largest iron ore producers in the world (and iron ore their top revenue earner) have made clear they intend to continue slamming prices lower by increasing production.
A major goal appears to be to push the weakest players so far down the cost curve they have to exit the industry, and to the winners, with the most tightly controlled costs and precisely calibrated margins, the spoils.
There is an unpleasant air of inevitability in all this, even though the strategy seems reckless on some levels.
And it’s certainly not painless.
Underlying net income growth at all iron ore producers has largely stagnated over the last two financial years, at best.
A similar picture is forecast for the next few years.
And several senior executives in the sector over the last several months have warned that their firms face dire consequences sooner or later.
For instance the managing director of Australia-based Minerals Resources Ltd. voiced pessimism in an interview with Sydney Morning Herald on Thursday about prospects for his firm, in the event that production costs eat any further into margins.
“If it gets to a point where it is below our cash costs we would turn off (production)” Chris Ellison said.
“That is not too far away from where we are now”.
The commodity price low has weighed further on shares of the most exposed major producers this week, including today.
Those listed on the FTSE 100 include Anglo American, Rio Tinto and BHP Billiton.
All extended their recent declines by more than 2% each on Thursday.
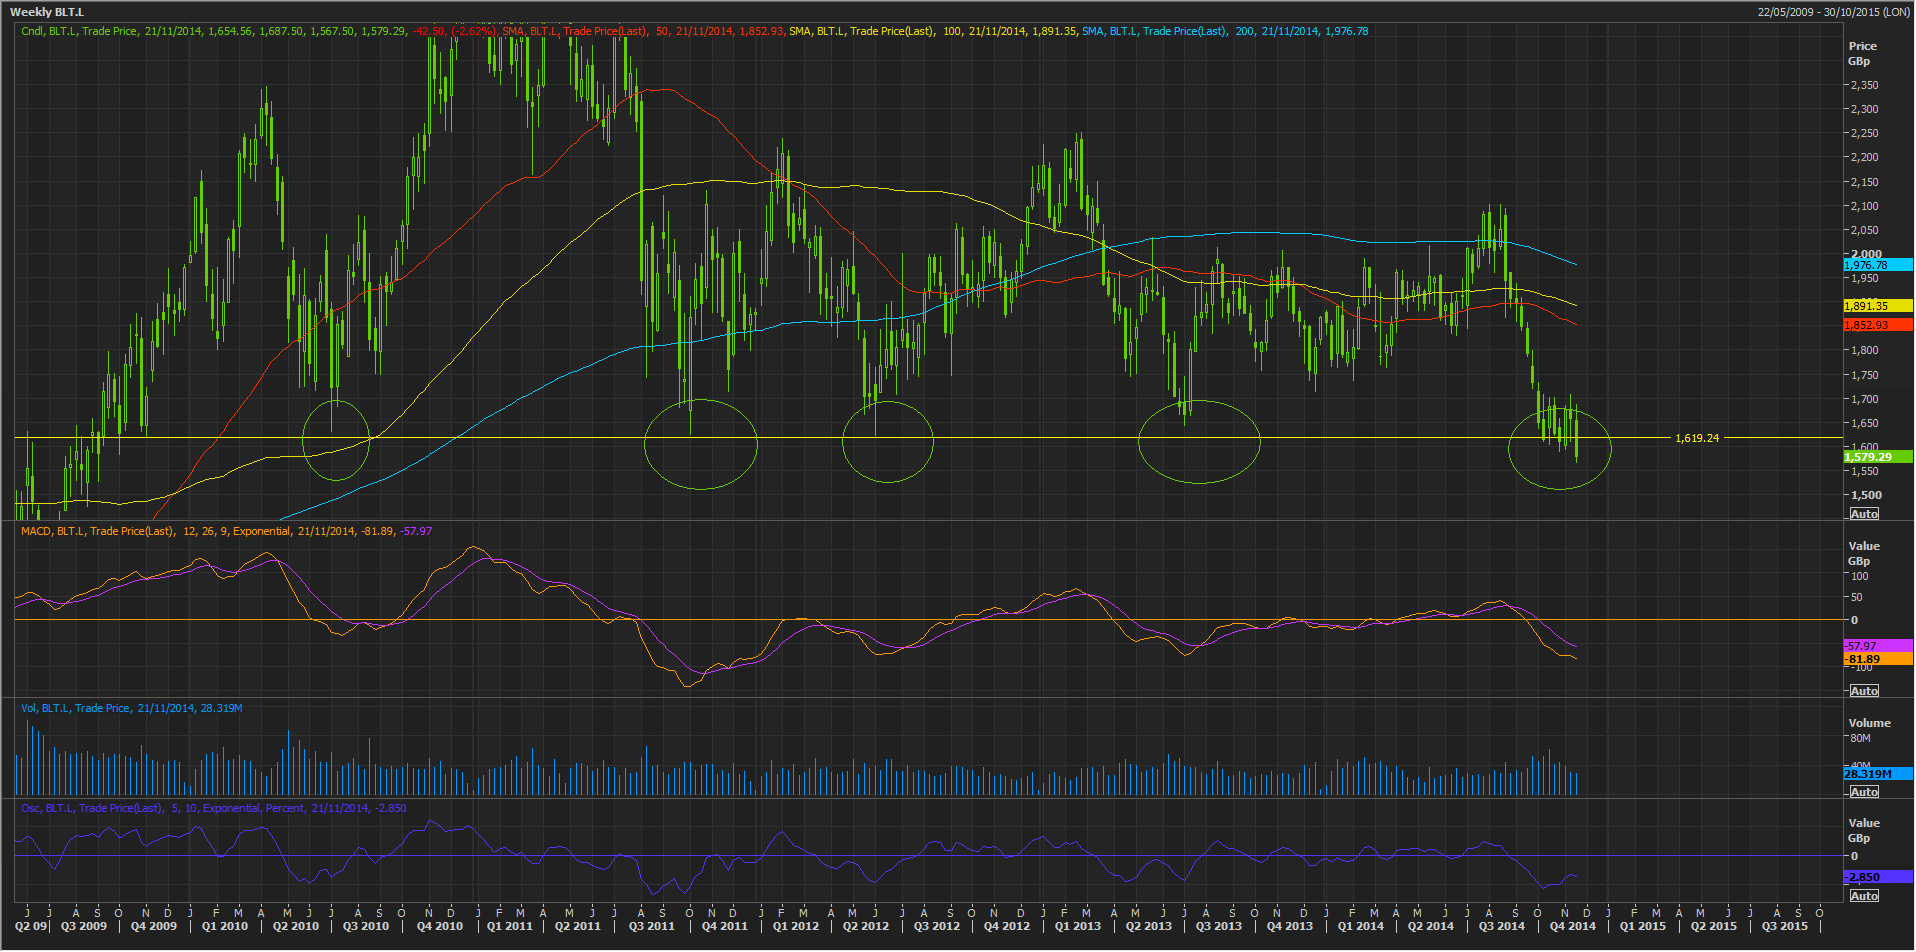
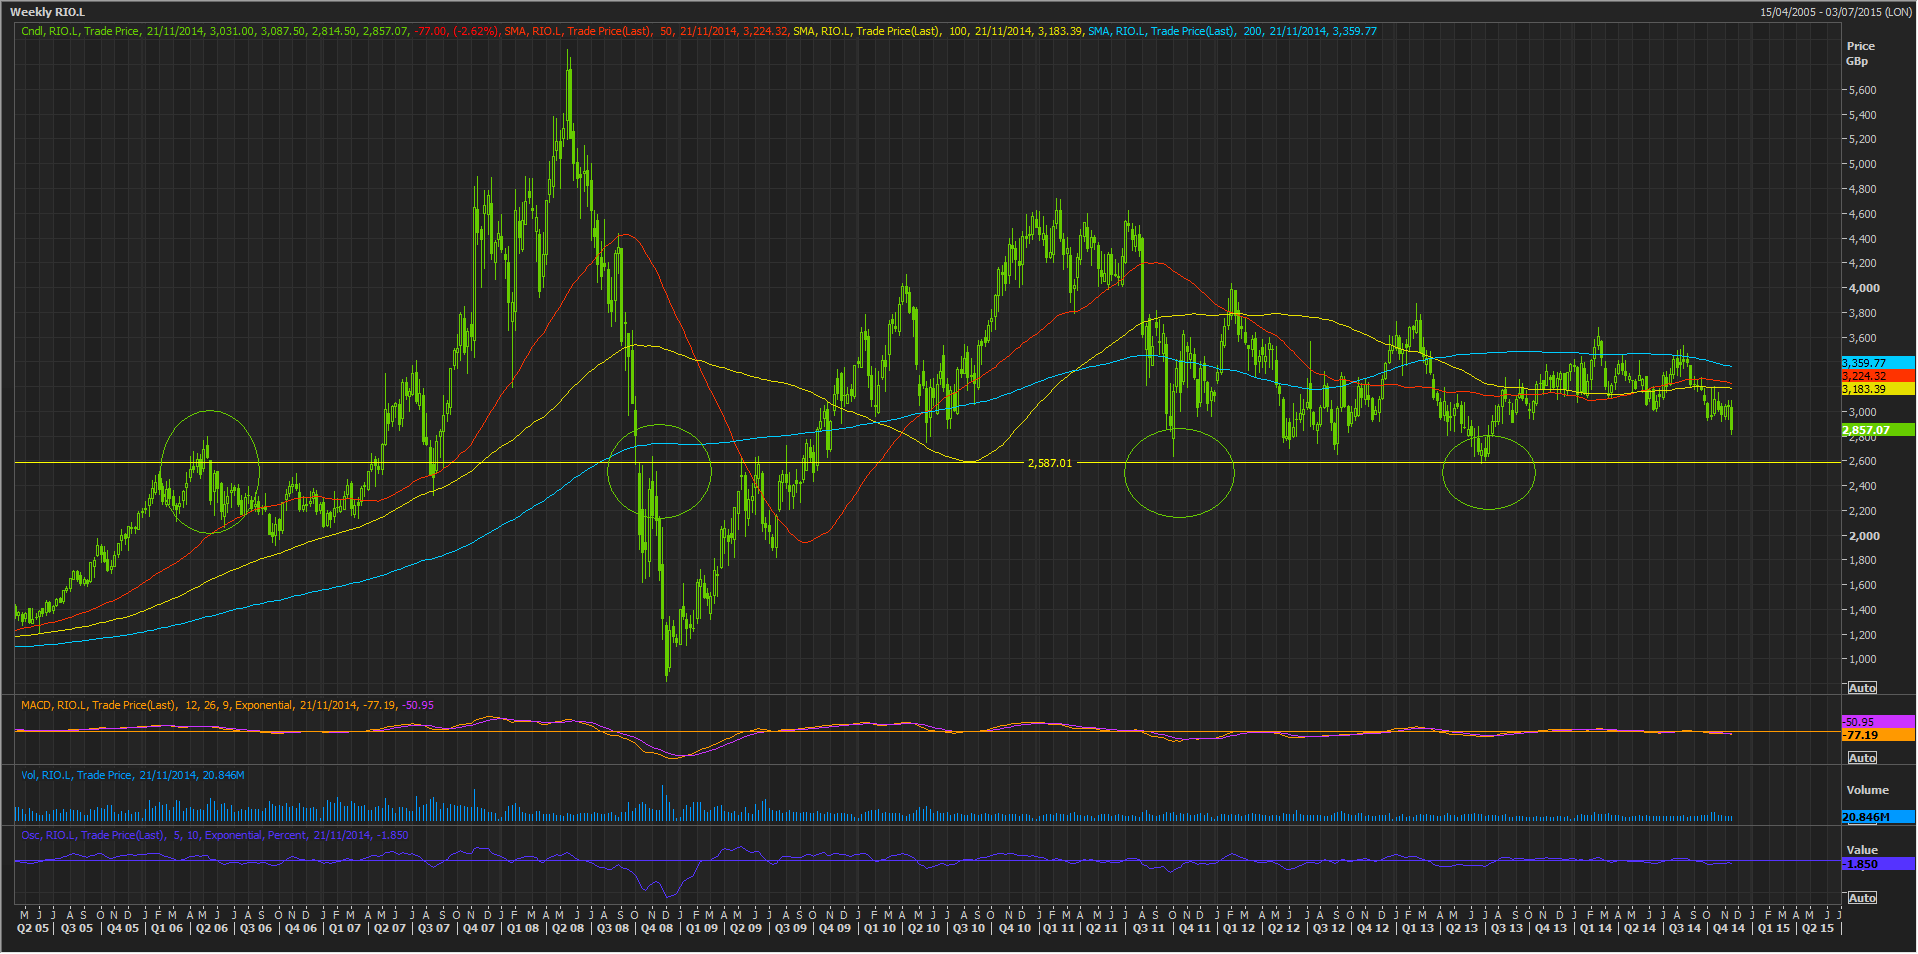
Of these, we have identified BHP and Rio as the stock’s which may face the most significant further downside soon.
Taking their weekly charts, we can see that both shares are loitering close to levels that have provided frequent support over the years.
There’s a similar picture in these names in City Index trading, although shorter-term time frames suggest selling may pause—for instance in the half-hourly chart of Rio Tinto Daily Funded Trade.
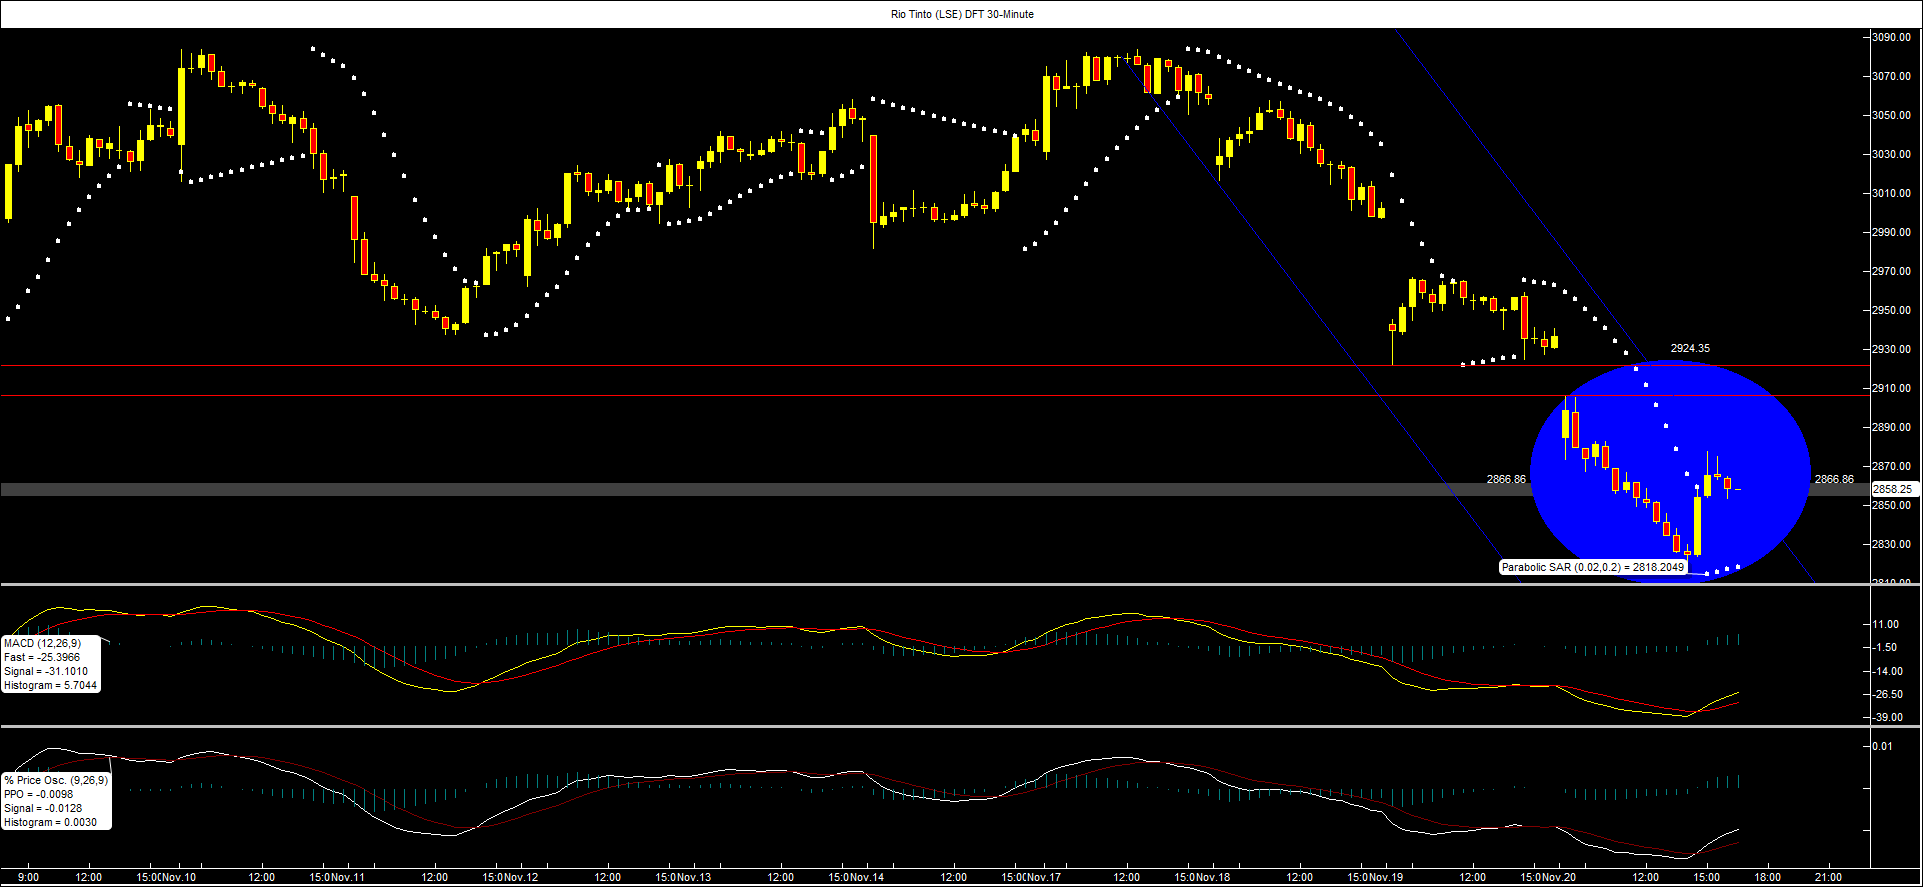
Here we see the lower markers on the parabolic stop-and-reverse system have suggested a temporary base, whilst momentum indicators (MACD and percentage price oscillator) have inverted, implying momentum bias is edging towards the buy side.
Friday’s early trading will provide a clearer idea of whether the scenario implied here may continue.
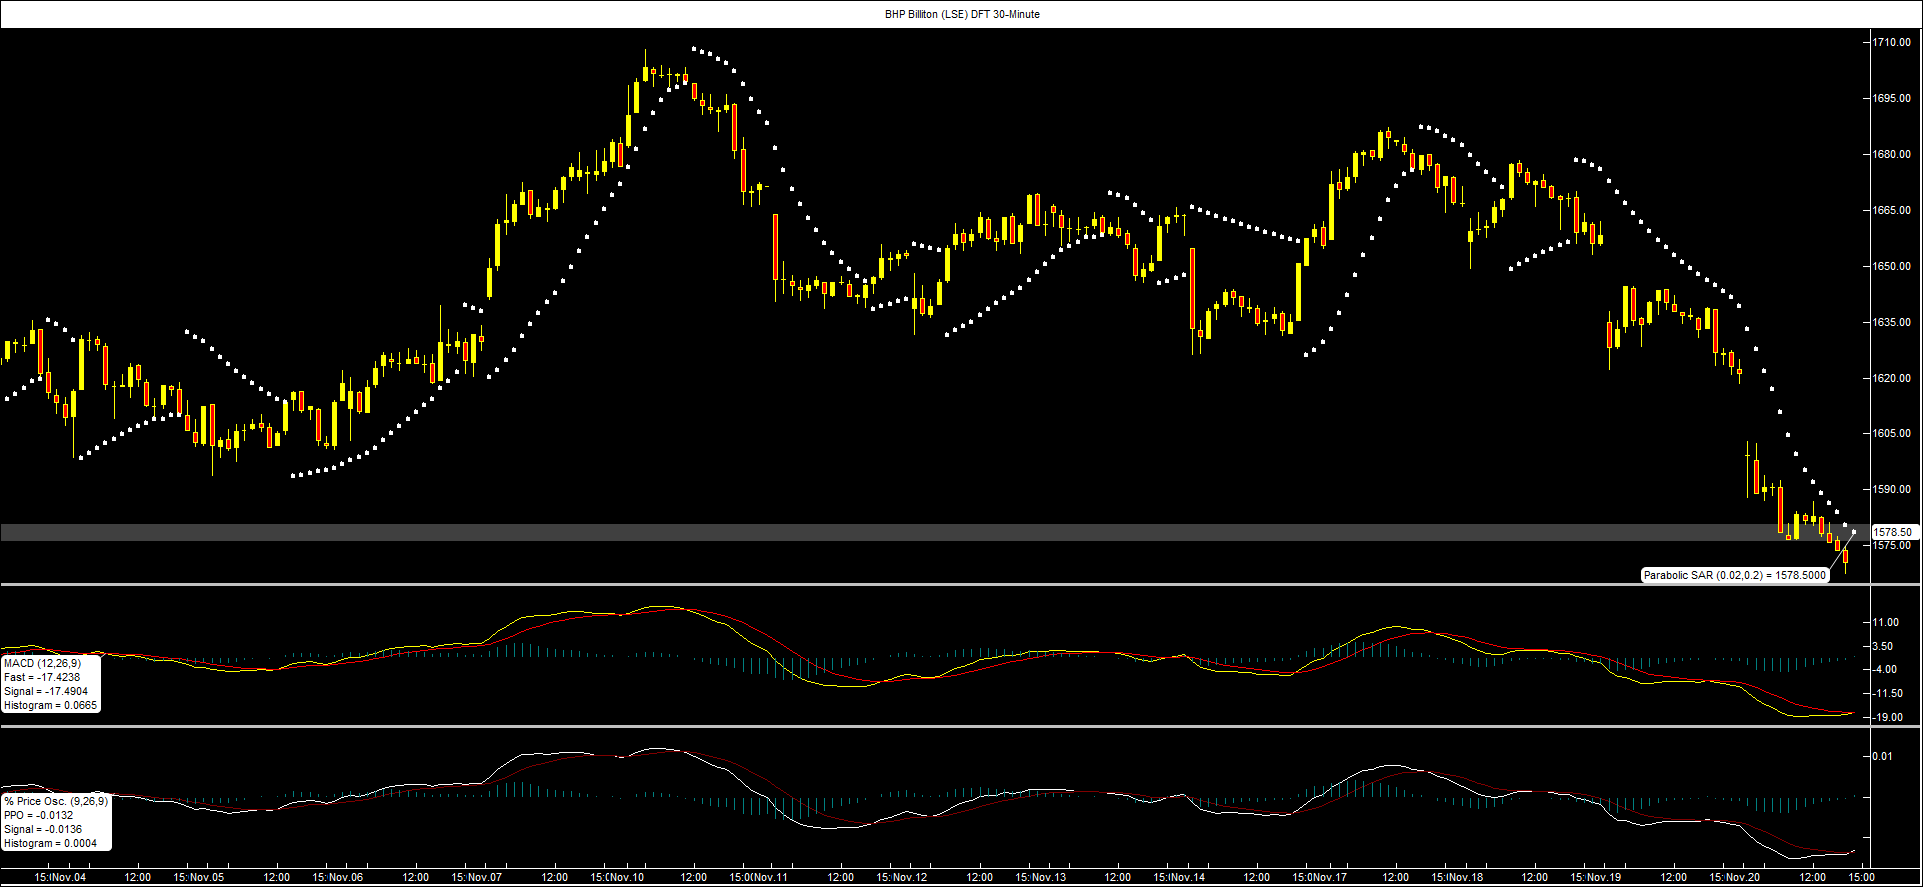
As for the half-hourly chart of BHP Billiton Daily Funded Trade, it immediately looks less promising.
No base has been calculated by the parabolic SAR system and whilst there’s some inversion in the momentum indicators, it seems far too subtle, right now.
