


October 15, 2021 4:35 PM
US Retail Sales for September MoM increased by 0.7% vs an expectation of -0.2%. August’s print was also revised higher from 0.7% to 0.9%. It appears Americans haven’t been affected yet by any increasing costs due to supply chain issues. Retail sales ex-autos MoM for September were up 0.8% vs an expectation of 0.5% and an August revision from +1.8% to +2%. We’d be remiss however, if we didn’t note that the New York State Empire Index for October was only 19.8 vs 27 expected and a September print of 34.3. The NY State Index is the first of the regional October manufacturing prints. This points to slower factory growth (mainly because of higher delivery times and higher prices paid). Relating the NY State Manufacturing Index to Retail Sales (on a month delay), it insinuates that although Americans are still buying, they are waiting longer and paying more for the same products. Watch the Manufacturing Indexes over the next few weeks to see if this is the beginning of a trend.
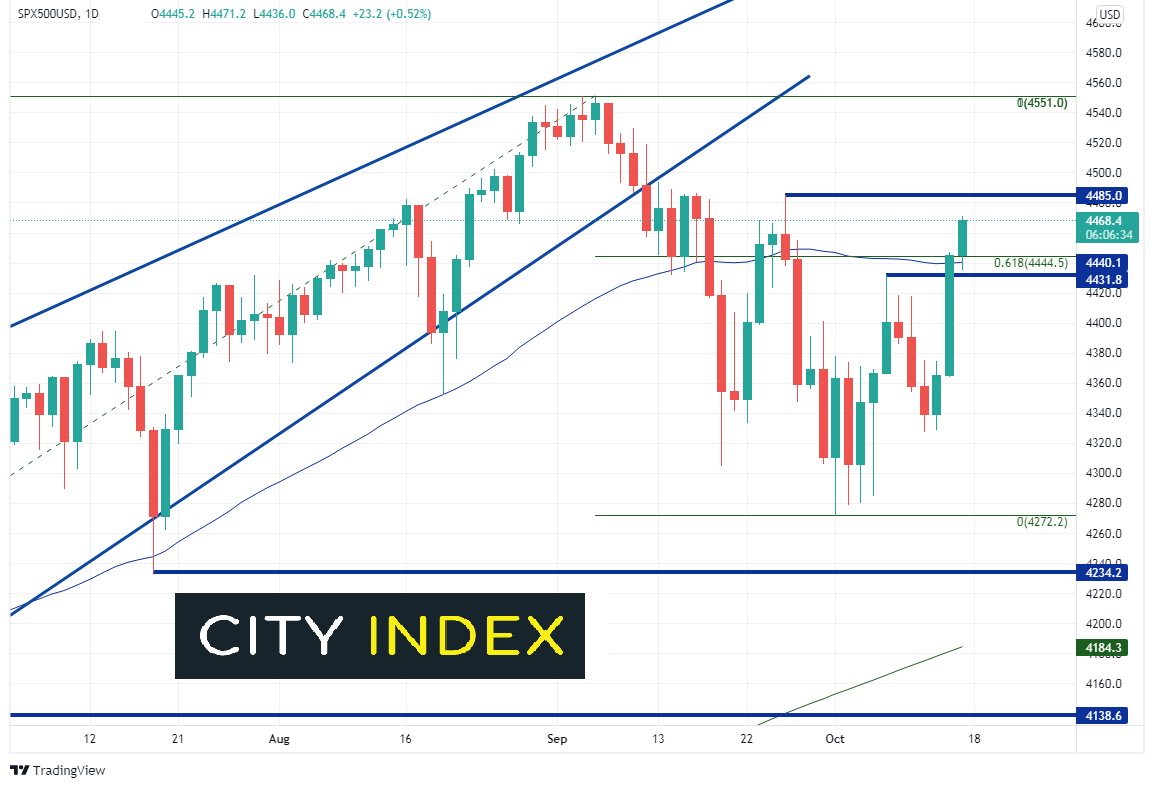
The S&P 500 is “ignoring” the stronger retail sales data, moving higher above the 61.8% Fibonacci retracement from the all-time highs on September 3rd to the lows of October 1st, at 4440.5, In addition, the large cap index moved back above the 50-Day Moving Average, which it hasn’t traded above since September 17th. By “ignoring”, it is meant that since March 2020, good data has been bad for stock markets, as it would mean that the Fed is closer to reducing monetary stimulus. Is it possible that the S&P 500 is already pricing in a November 3rd taper announcement? Horizontal resistance is at the September 27th highs of 4485 and then the previous all-time highs at 4551. Support is at the 50 Day Moving Average near 4440.1, the highs of October 7th near 4431.8 and the October 14th lows at 4364.7.
Source: Tradingview, Stone X
Trade EUR/USD now: Login or Open a new account!
• Open an account in the UK
• Open an account in Australia
• Open an account in Singapore
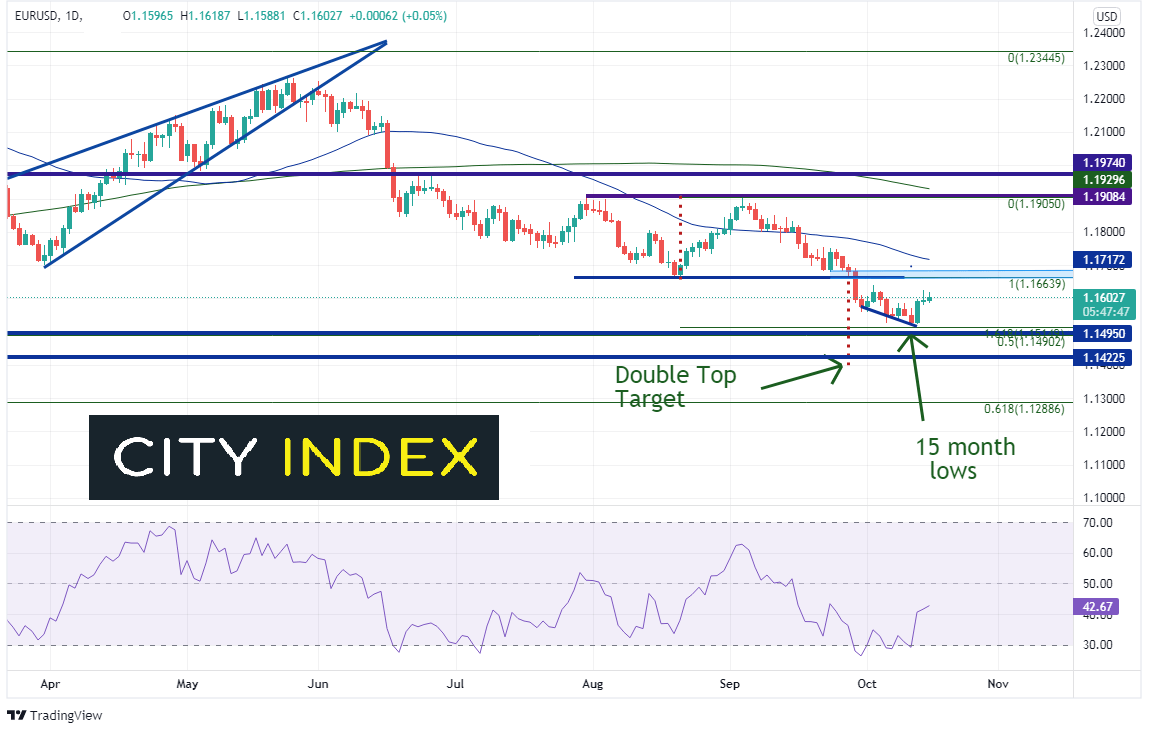
On the other hand, EUR/USD has barely budged. After yesterday’s shooting star candle (a reversal signal), the pair is drifting within yesterday’s range between 1.15839 and 1.16244. As the retail sales and NY State Manufacturing Index doesn’t seem to be affecting the US Dollar, it appears the pair is waiting for the next catalyst. (Note that if EUR/USD closes above 1.15839, it will invalidate the shooting star). Resistance is at previous lows of 1.1664, ahead of the 50 Day Moving Average at 1.17173. First support is at the October 12th 15-month lows at 1.15245, and then a confluence of support between 1.14902 and 1.15149. Notice that the RSI has unwound from oversold levels, giving the green light to the pair to move lower.
Source: Tradingview, Stone X
Everything you wanted to know about the Euro
Markets appear to be ignoring the stronger retail sales print heading into the weekend. Earnings season continues next week, with NFLX being the first of the FANNGs to report. Watch for guidance from companies to see if they are fearful of supply chain issues or higher inflation. Earnings guidance may be the next catalyst!
Learn more about forex trading opportunities.


