


May 28, 2020 2:10 AM
With month-end rebalancing flows now underway that often lead to whippy and unpredictable moves in FX markets and the month of June shortly upon us, we take this opportunity to update our view of the S&P500, the preferred barometer of risk sentiment.
As things stand currently, the S&P500 is on track to register a gain of almost 5% during May - consolidating and building upon its impressive 13% rally in April.
In terms of the drivers behind Mays rally, central bank activity and rhetoric have remained ultra-supportive. Trials indicate a coronavirus vaccine might be available sooner than expected. Also at play, an encouraging re-opening of economies, that marks April as a trough for growth.
Not to mention an ability to shake off a worrying escalation in Sino-U.S tensions over the coronavirus and Hong Kong as well as a the shackles of the historically weak month of May.
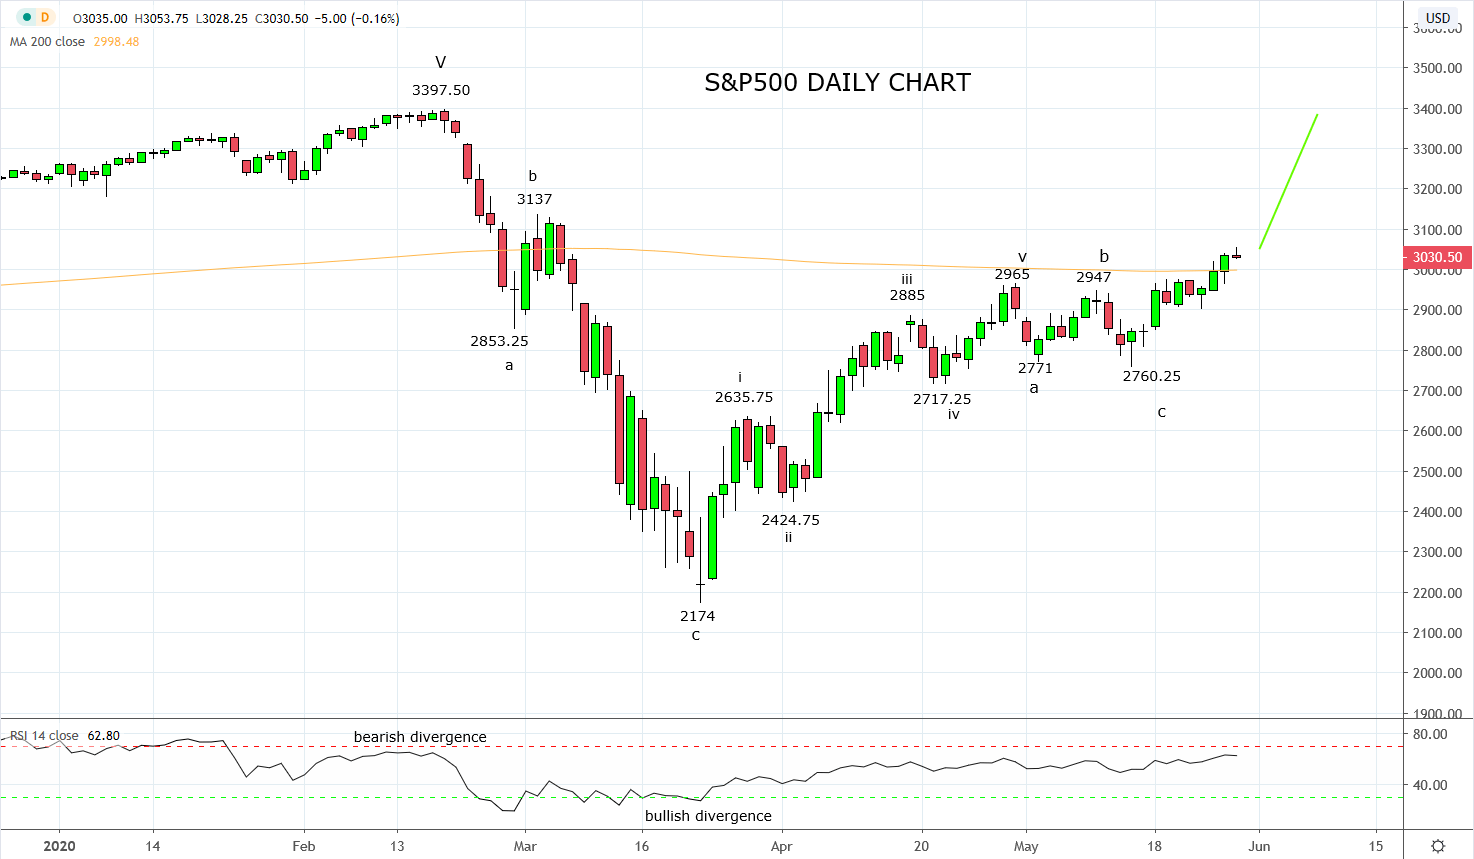
In our last article on the S&P500 at the end of April here we concluded that the appearance of a five-wave from the March 2174 low to the April 2965 high, signalled the uptrend had resumed and should soon be followed by a corrective pullback.
“Keep in mind that after this five wave rally is completed, a pullback is likely before the uptrend resumes. In this context, our preference in coming weeks is to buy countertrend/corrective pullbacks, looking for a retest and break of year to date highs.”
The pullback to the May 2760.25 low unfolded in three waves and fits nicely within the countertrend/corrective roadmap outlined above. This week’s break to new highs was a positive development and also the minimum requirement following the completion of the correction.
Providing the S&P500 can now post a second consecutive daily close above the 200 day moving average at 3000, it would indicate that the next leg higher towards the layer of resistance near the March 3137 high is underway, with scope then towards the all-time high of 3397.50.
Keeping in mind, should the S&P500 fail to post a second consecutive daily close above 3000 and then close back below near term support 2965/45 (from recent highs), it would suggest the bullish move has lost traction and risks a return back towards the layer of medium-term support ahead of 2720.
Source Tradingview. The figures stated areas of the 28th of May 2020. Past performance is not a reliable indicator of future performance. This report does not contain and is not to be taken as containing any financial product advice or financial product recommendation
Latest market news
Yesterday 03:00 PM
Yesterday 01:12 PM
Yesterday 11:14 AM
Latest Wall Street articles
August 8, 2023 09:54 AM
July 26, 2022 03:39 AM
June 30, 2022 08:10 AM
June 22, 2022 02:56 AM