RBS creeps up on Barclays as worst UK bank share
RBS just rounded off a dire first quarter for UK banks with an almost £1bn loss, the worst result of the ‘Big 3′. Lingering regulatory […]
RBS just rounded off a dire first quarter for UK banks with an almost £1bn loss, the worst result of the ‘Big 3′. Lingering regulatory […]
Lingering regulatory costs and legal entanglements continue to take their toll. These, combined with investor worries about Brexit have pushed the sector deep into the red for the year.
Barclays shares have been the worst performers in 2016, falling more than 20%, but Royal Bank of Scotland has crept lower in recent sessions, extending its 2016 loss to almost 19% at the time of writing.
The Edinburgh-based bank is likely to try investor patience further after warning on Friday that a host of major issues will linger for longer.
The group also missed expectations for its capital buffer: that came in at 14.6% compared to 15.6% expected by analysts, though above the 11.5% reported for Q1 2015; whilst its £968m loss was above the average £957m analyst forecast compiled by RBS itself.
Many investors may decide enough is enough. For instance, US brokerage Bernstein told clients this morning RBS’s admission on Thursday that it wouldn’t meet a deadline for selling its William’s & Glyn branches was the final straw. “With the excess capital now being tied to … the W&G surgery where we have no option but to trust management’s view on complications, we have decided to get out”, said Bernstein.
We think they’ll have company.
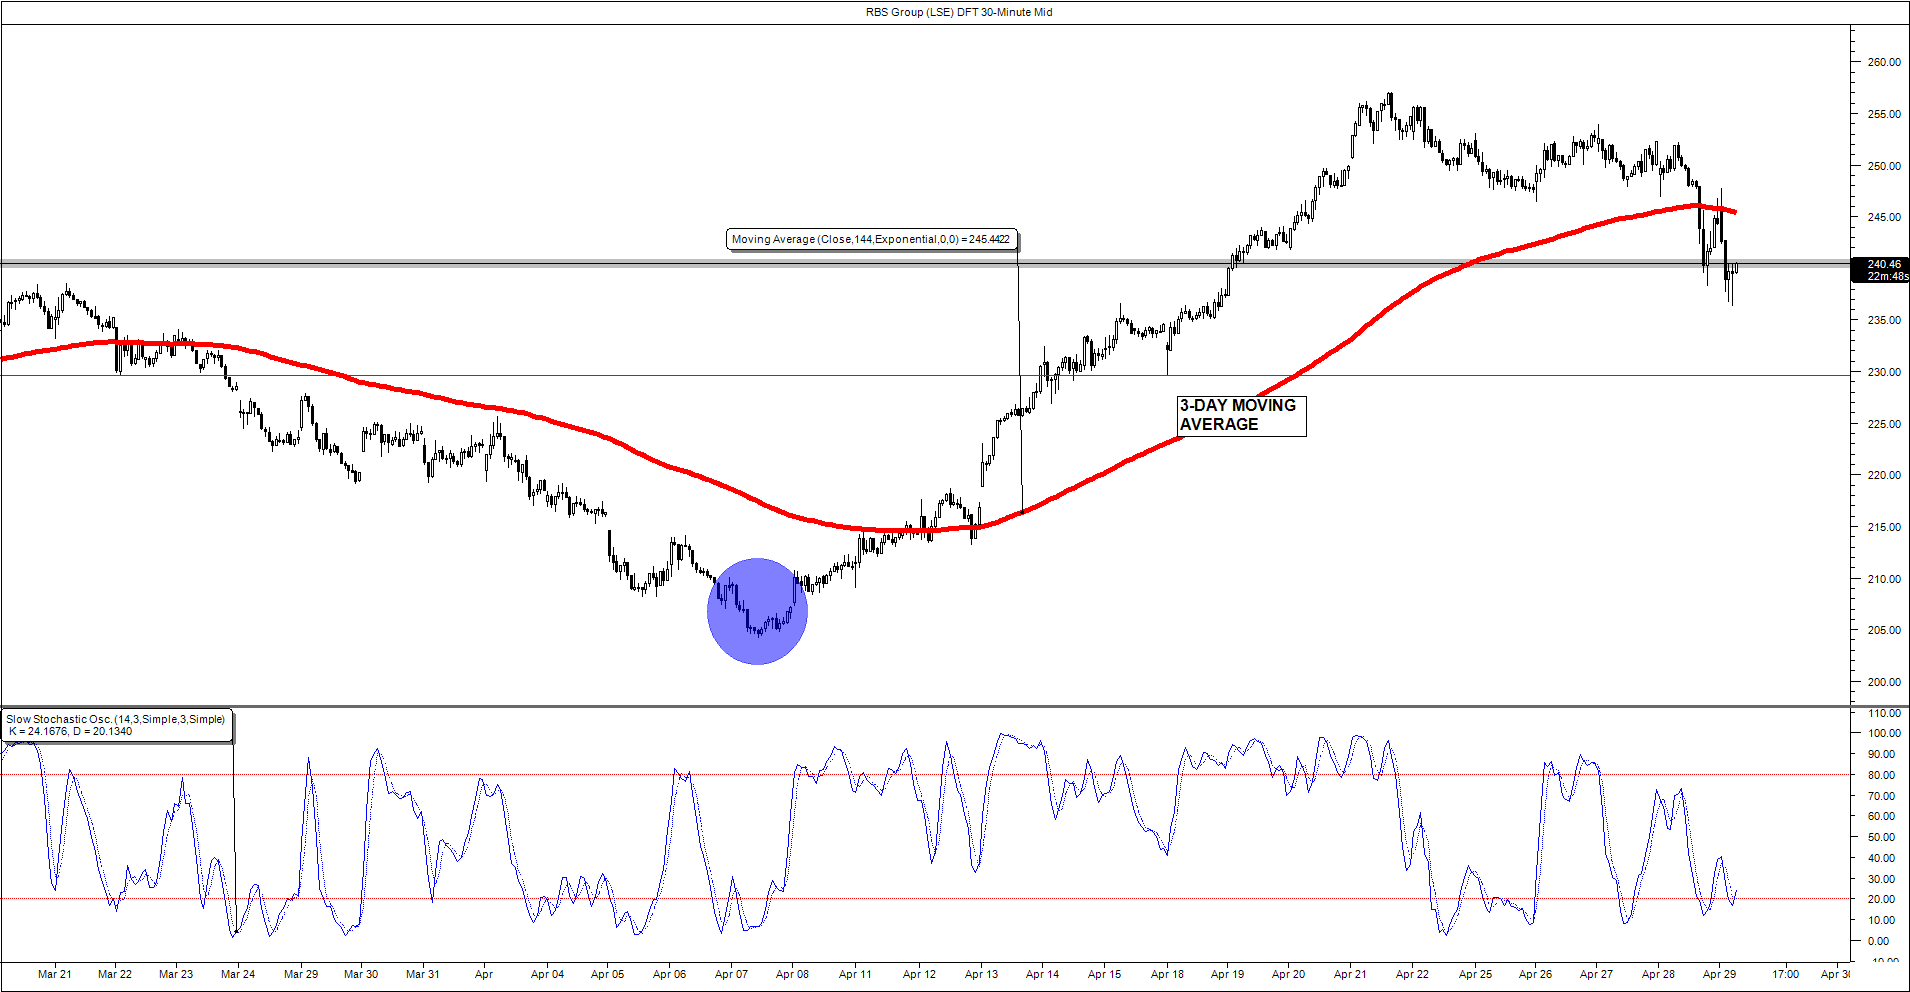
From a short-term technical perspective, the slump of RBS shares below the 3-day moving average (MA in red in our chart below) corroborates the view that the stock’s weak phase has been exacerbated.
Note: three days is equal to 144 half-hour periods as stated within the chart.
The stock traded 2.2% lower at the time of writing, approaching 230p, a ‘psychological’ level for investors, at which the price bounced earlier this month.
Should current selling break through 230p in the near term, the chance of a return to RBS’s lows for the year, seen earlier this month around 204p, would increase.
The stock cannot be said to have regained poise before getting back above the MA mentioned above.
Please click image to enlarge
