Randgold glitter will fade to a glow
If it’s essential to be a mining company in the middle of an apparent ‘super cycle’ collapse, it probably helps to be a gold mining […]
If it’s essential to be a mining company in the middle of an apparent ‘super cycle’ collapse, it probably helps to be a gold mining […]
If it’s essential to be a mining company in the middle of an apparent ‘super cycle’ collapse, it probably helps to be a gold mining company.
Randgold Resources might be the latest global miner to demonstrate this after it reported full-year mining profits of $572.2m, enabling it to wait for it—hike, not cut, hike its dividend.
Again, this is becoming a rarity in mining.
Randgold has managed to raise its final payout by 10% to 66 cents a share, despite profits for the year ending 31st December sliding 11%.
The income slide is barely surprising given that gold prices sank for a third straight year in 2015, as did pretty much prices of all other metals.
The market had expected much worse income from Randgold, judging by (as yet ‘unaudited’) revenues of $1bn which missed expectations by almost 4%, according to Reuters data, especially if we apply FY 2014′s 45.7% gross margin to it.
Reported EPS of $2.01 also looked definitively higher than forecasts that averaged around $1.95.
All this enabled CEO Mark Bristow to claim with just a smidgen of hype that 2015 was “one of the best years in the company’s history”, adding that it was “easy to achieve when the stars are all aligned but it’s a lot more difficult in a market as challenged as this one, which makes these results even more pleasing.”
A production rise of 6% helped, but a cash cost reduction of 75% is probably the single biggest achievement Randgold investors cheered with a share price jump as high as 12.5% on Monday.
RRS’s cash (and equivalents) balance has perhaps understandably, also been accumulated exponentially, rising 26% to $213.3m.
That’s even more remarkable for a firm, that admittedly like many peers, typically traded quite modestly in the black during boom times, keeping net cash of just $82m at the end of 2014.
There are no absolute mining winners in a metal demand slump like this though.
And tough decisions made on costs in the year, including foregoing an opportunity in Ghana due to a risk it might have deemed ‘calculated’ in less straitened times, could yet come back to haunt Randgold.
Few investors will bet on a double-digit dividend rise being announced in February 2017 either.
But then, few would probably call an end to even the precious metals doldrums by then.
After RRS’s cost measures sparked a 50% surge in the closing months of the year it still undershot rival gold diggers Centamin and Fresnilo, which rose about 5.43% and 9% in 2015.
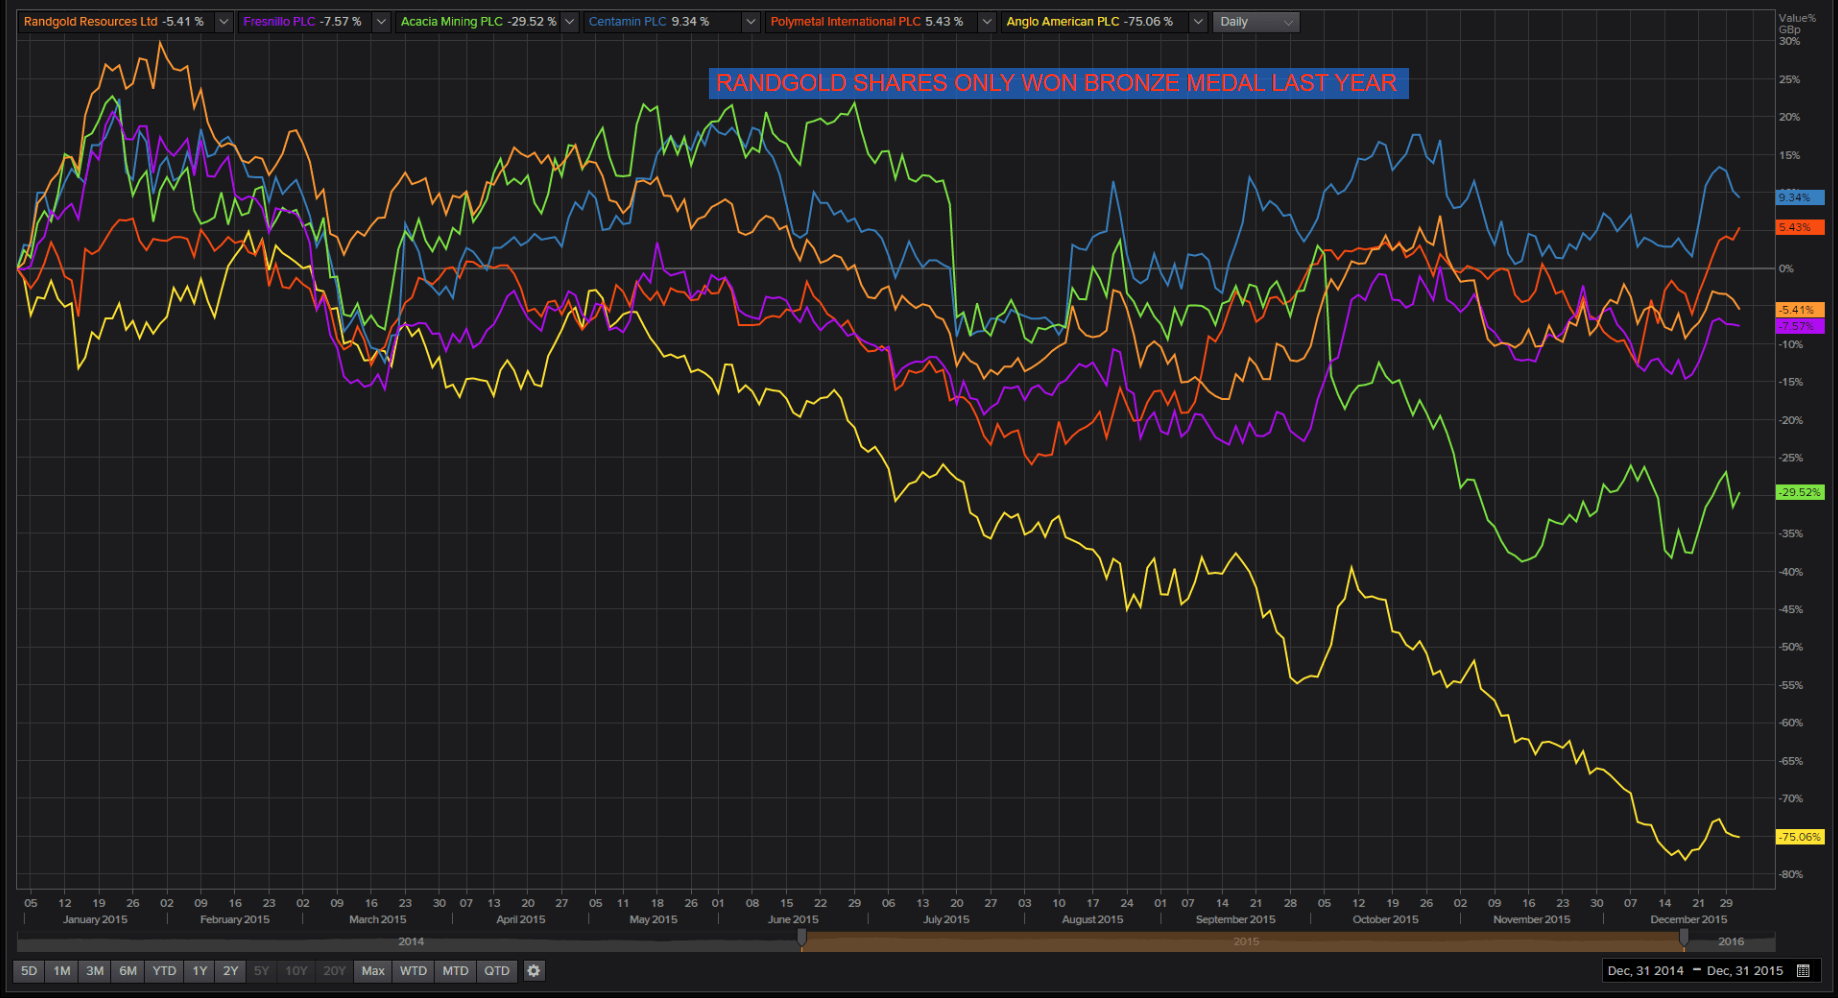
Please click image to enlarge
As an investment though, Randgold was still a relatively safe harbour.
Its total return loss was barely 2 percentage points worse than the ‘best’ in its group, Polymetal.
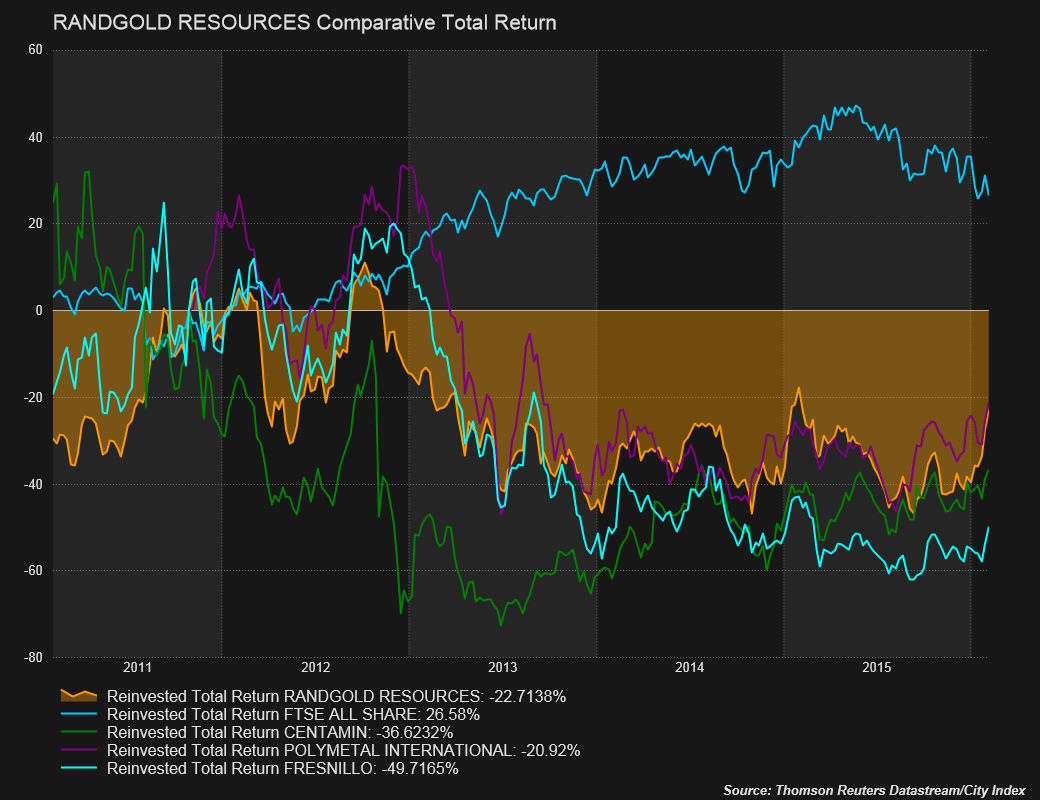
Please click image to enlarge
Through a glass darkly
That suggests—skewed metrics aside—Randgold shares may be due a re-rating in the year ahead.
RRS’s price-to-EPS ratio was trading 28% below the third quartile of FTSE All-Share gold miners at last check.
Furthermore, its sensible dividend policy was reflected by the very contained 0.8% market expectation for its yield in the next 12 months, before Monday’s announced hike.
The policy will still remain sustainable from cash for 2016 at least.
(Borrowing is expected to have ticked 0.1% lower when Randgold reports final results in May).
There again, as suggested, most readings are distorted right now by the dire industry picture of dormant demand and eroded earnings.
On that basis, whilst Randgold acquitted itself well last year, its share price rise on Monday has been relatively tardy—even after extending Monday’s gain to above 11% at the time of writing.
The deeply troubled overall investment environment is partly to blame.
Investors will also be wary of Randgold’s near-parabolic share price rise since mid-January.
The stock was 30% up from 15th January; 57% higher than 2015 lows in September.
Topping-out momentum indicators in the overbought zone, including Slow Stochastic, should also be an early warning signal.
As should the 90p gap between Friday’s close and Monday’s low.
It’s likely to be filled relatively soon.
A much harder slingshot therefore looks required under the circumstances to lob RRS sustainably over last year’s 5752p high (3rd February 2015) which also coincides with a major Fibonacci projection from 2015’s low.
That said, major resistance over the last year or so, which may now provide solid support is also visible to the naked eye.
The neckline of a too-wonky-to-be-strictly-permissible inverse head (H) and shoulders formation may also bolster the price so long as it’s not breached in the near term.
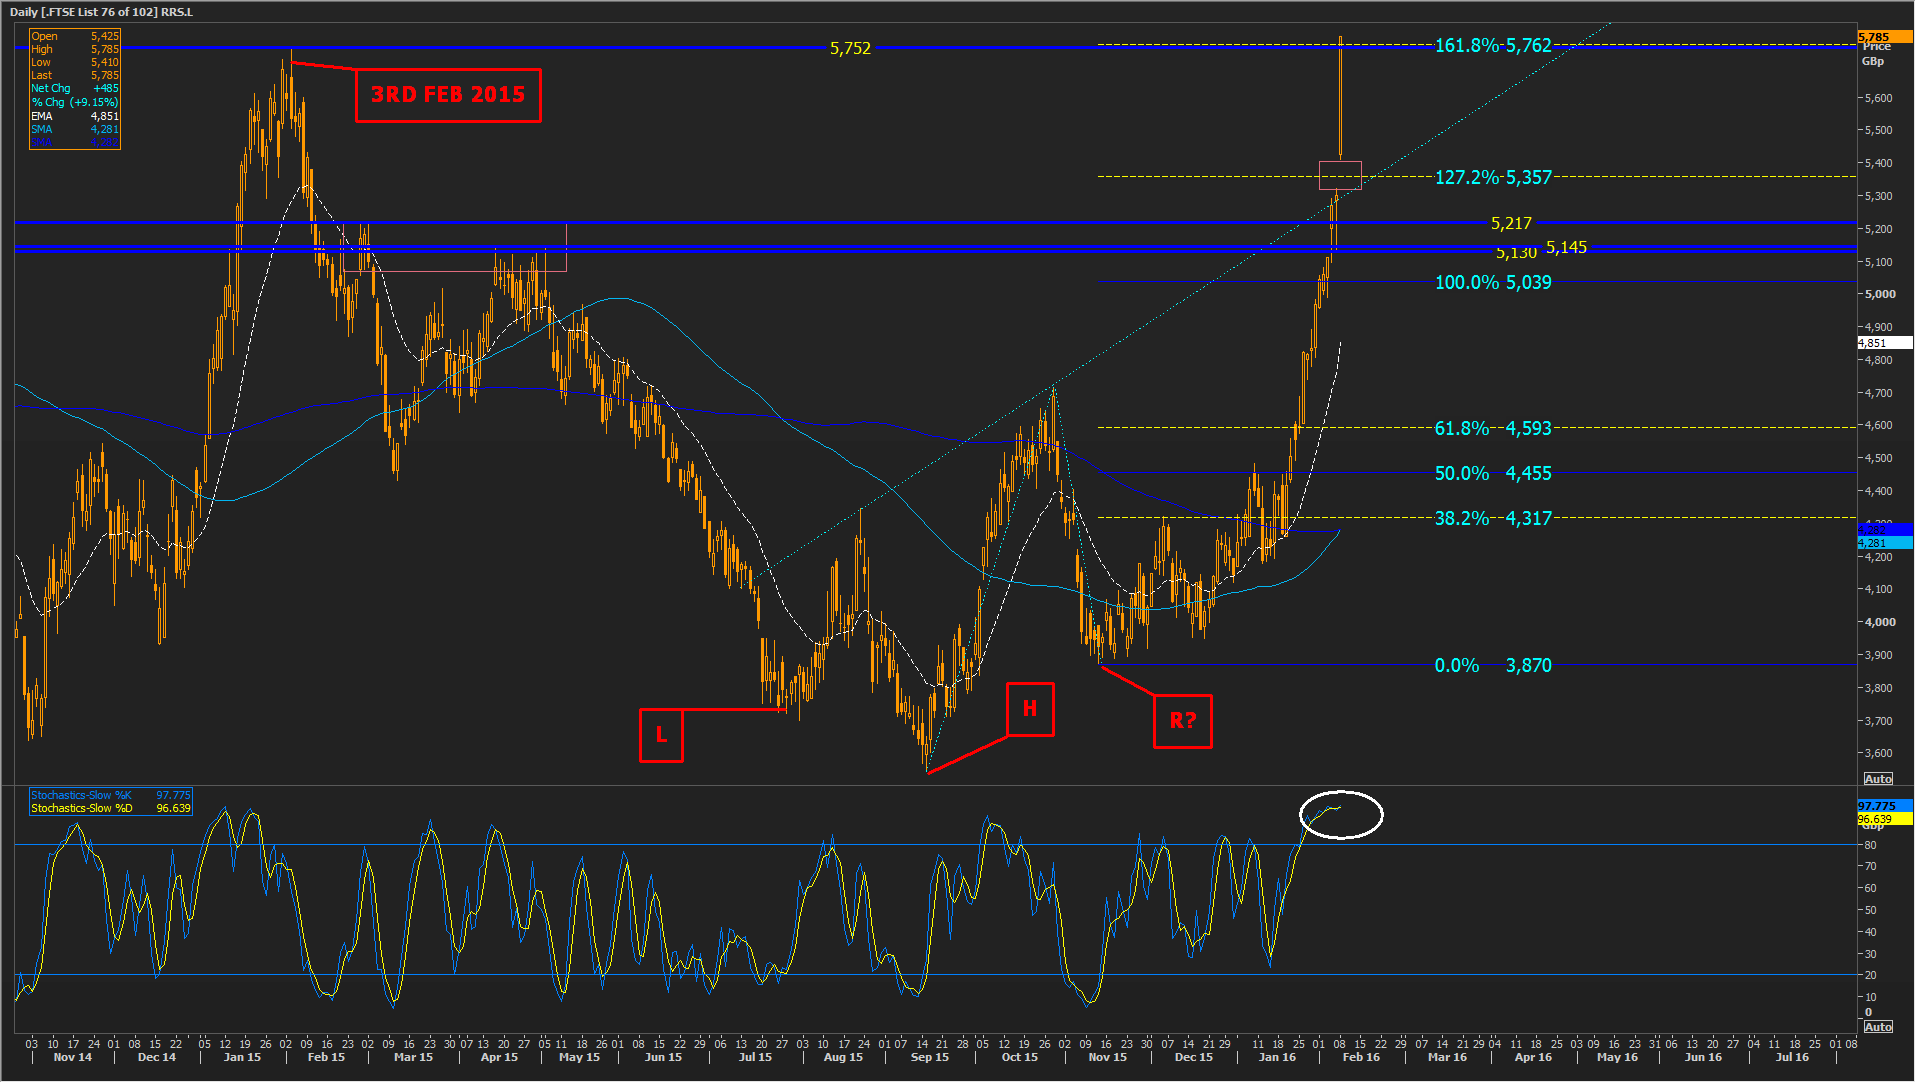
Please click image to enlarge
