


April 16, 2020 6:01 PM
Puttin’ on the VIX
I reside in the United States, in a state that has a high number of coronavirus cases. It doesn’t seem like there is any end in sight. Throughout the US 4 weeks of initial claims data show that nearly 22,000,000 people have applied for unemployment benefits. There is unprecedented Monetary Policy action abd fiscal deficits at or near all-time highs. We are at the beginning or earnings season, and thus far it hasn’t been pretty. Forward guidance has been significantly lowered or removed altogether. People aren’t back to work. Schools haven’t reopened. Granted, AMZN is trading at record highs and NFLX is right with it (No surprise, given the lockdowns). But companies such as GE are near lows not seen since 1992! Has the market priced in too much of an economic recovery too soon? Stock traders seem to have the mentality of “Things Can’t get Any Worse”.
With all this negativity one may think that the VIX is near record highs. However, that is hardly the case. On a daily timeframe, the VIX is trading at 40.10 and has stalled at the 61.8% Fibonacci retracement level from the lows on February to the highs on March 18th. There is also horizontal support at 36.20, which were the highs from December 2018 and the flash crash VIX spike lows from March 24th. Could this be the place where the VIX turns higher?
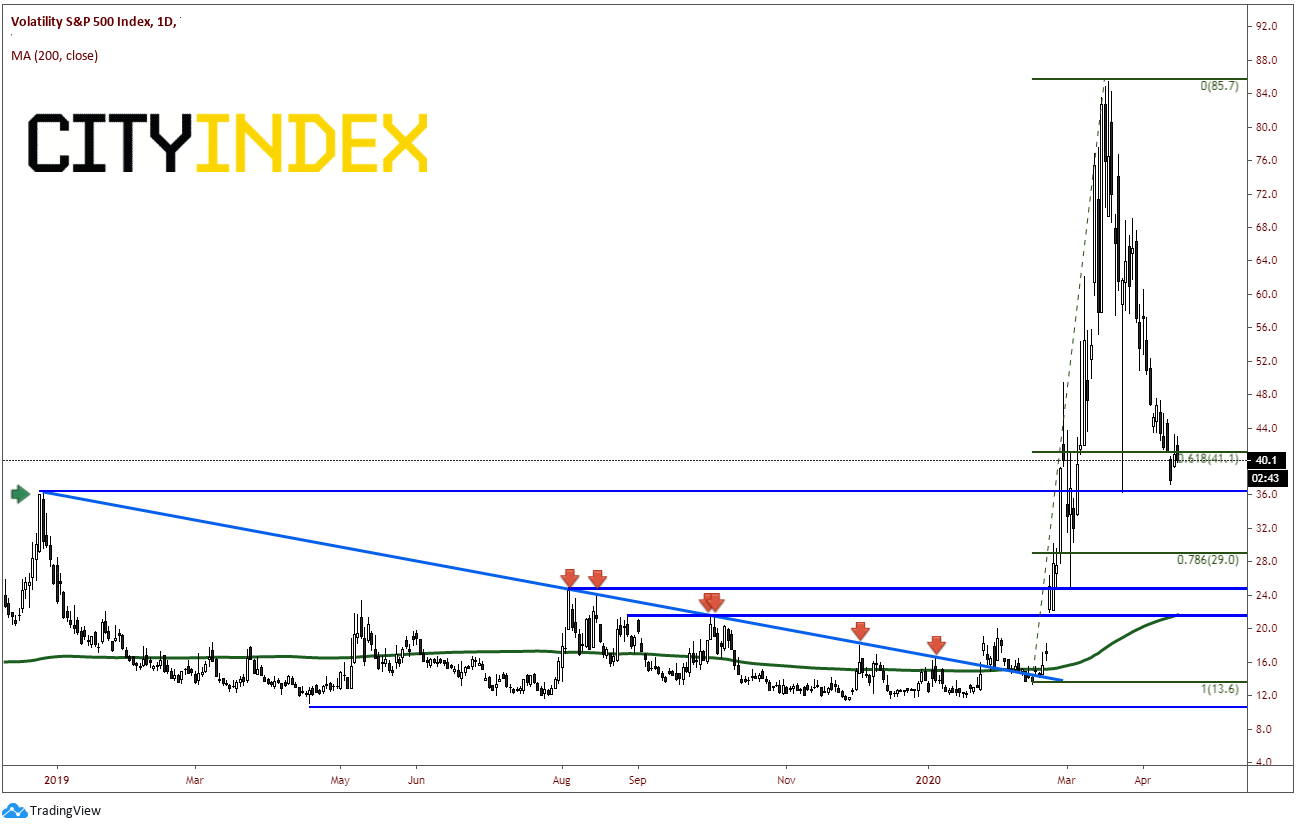
Source: Tradingview, City Index
On a 240-minute timeframe, VIX has been trading in a consistent downward sloping channel since March 25th, however the top trendline of the channel extends back to the highs on March 18th at 85.5. Yesterday, price moved above that trendline. Horizontal support crosses at that trendline near 36.40. Below there is a gap from 33.5 down to 32.10, and then an additional gap further down from 22.10 to 18.20. If the low is truly in from Tuesday, then first horizontal resistance is at 51.20. After that is the 38.2% Fibonacci retracement from the March 18th highs to Tuesdays lows at 55.70. If price breaks above there, the next level of resistance is at 58.0.
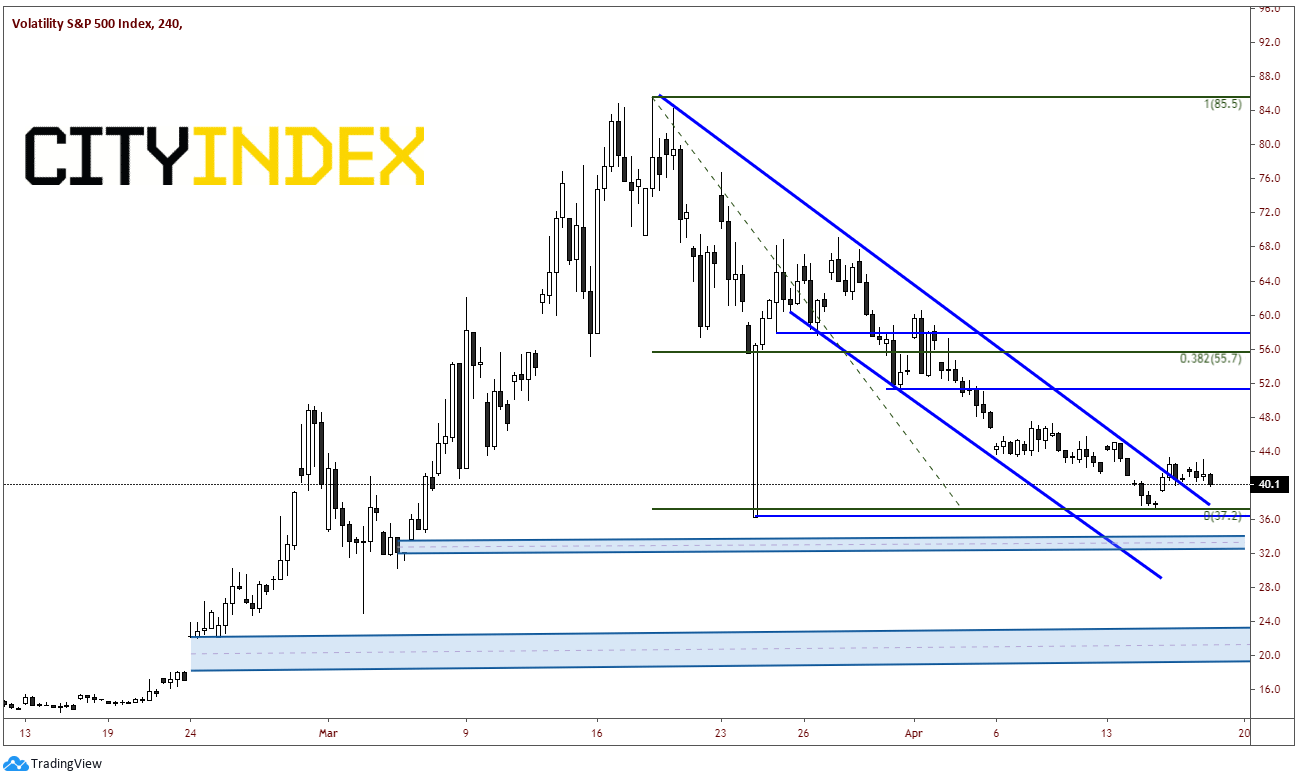
Source: Tradingview, City Index
If the VIX does trade higher to those resistance levels, stocks will have held current resistance now and turned lower. Traders thus will have realized that stocks have gone too far, too fast. However, if the VIX continues lower, then perhaps things ARE getting better???
Latest market news
Today 05:45 AM
Yesterday 11:09 PM
Yesterday 11:01 PM
Yesterday 04:00 PM
Latest Forex articles
Yesterday 11:09 PM
Yesterday 04:00 PM
Yesterday 04:19 AM
April 22, 2024 04:33 PM