Pullback into next week likely after a strong start
Trading has started with a positive note for 2013, seeing strong moves in the UK and US stock indices. Although trends on the short to […]
Trading has started with a positive note for 2013, seeing strong moves in the UK and US stock indices. Although trends on the short to […]
Trading has started with a positive note for 2013, seeing strong moves in the UK and US stock indices. Although trends on the short to intermediate term remain positive, it seems that there may be an opportunity to see a pullback going into next week. This may offer buying opportunities for the Bulls as the trend continues to see moves towards the upside. Having cleared resistance barriers over the last week, the markets may now be looking to reach further heights. But support levels below current prices will need to be respected and momentum will need to remain positive for the intermediate term timeframe. See key levels below:
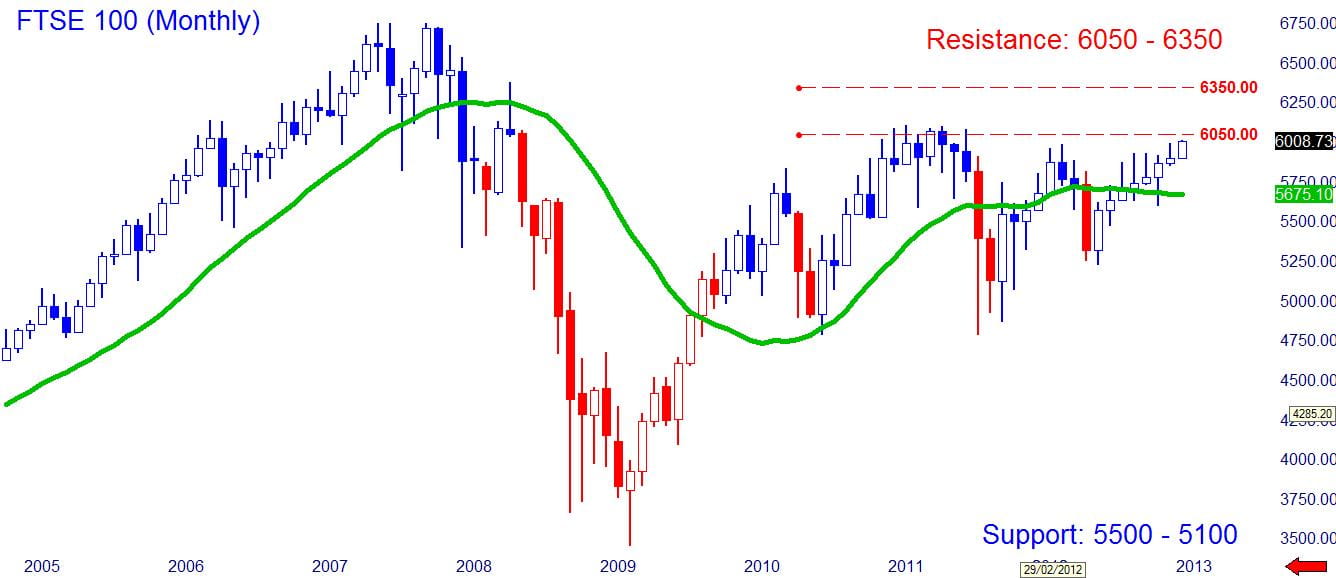
FTSE 100 maintains strength in first week
Having sustained support at the previous resistance level of 5900, the UK FTSE 100 remains on target to clear the 6000 psychological level to then reach for 6150 in the coming weeks. As long as the index can hold 5900 if a pullback occurs, it could be a platform to seek opportunities to establish positions on the Long side. The FTSE 100 continues to enjoy bullish momentum over the last few weeks and there are no signs of a bearish reversal for the moment. This does not rule out corrective moves but rather looking at pullbacks as a trend continuation opportunity rather than a trend reversal.
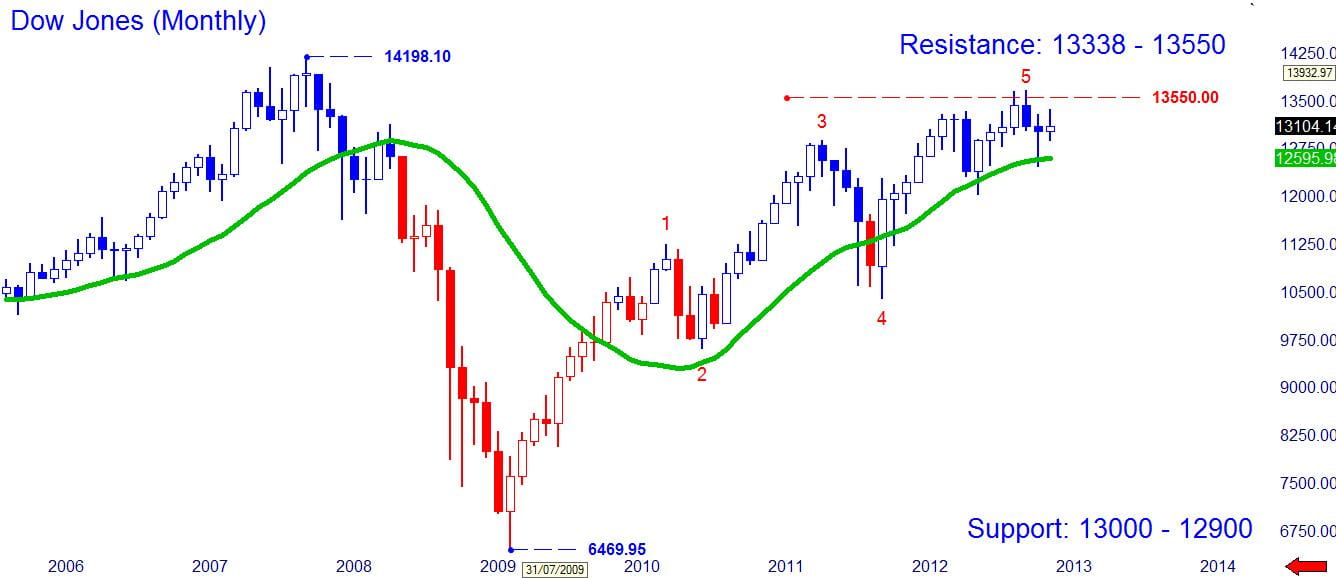
Dow Jones short term reversal at hand
The US Dow Jones index certainly packed a punch at the start of this week. Currently looking at Thursdays price action this suggests that if the index breaks below 13358 then the index may see a pullback heading into next week. On a short term basis the index will likely find support at 13216 – 13150 but on an intermediate basis the key support rests at 13000 which if violated may see a trend reversal take place for much lower prices. However given the current chart patterns and a shift in momentum to the upside this looks unlikely for the short term. As long as the index remains bullish we may look towards 13550.
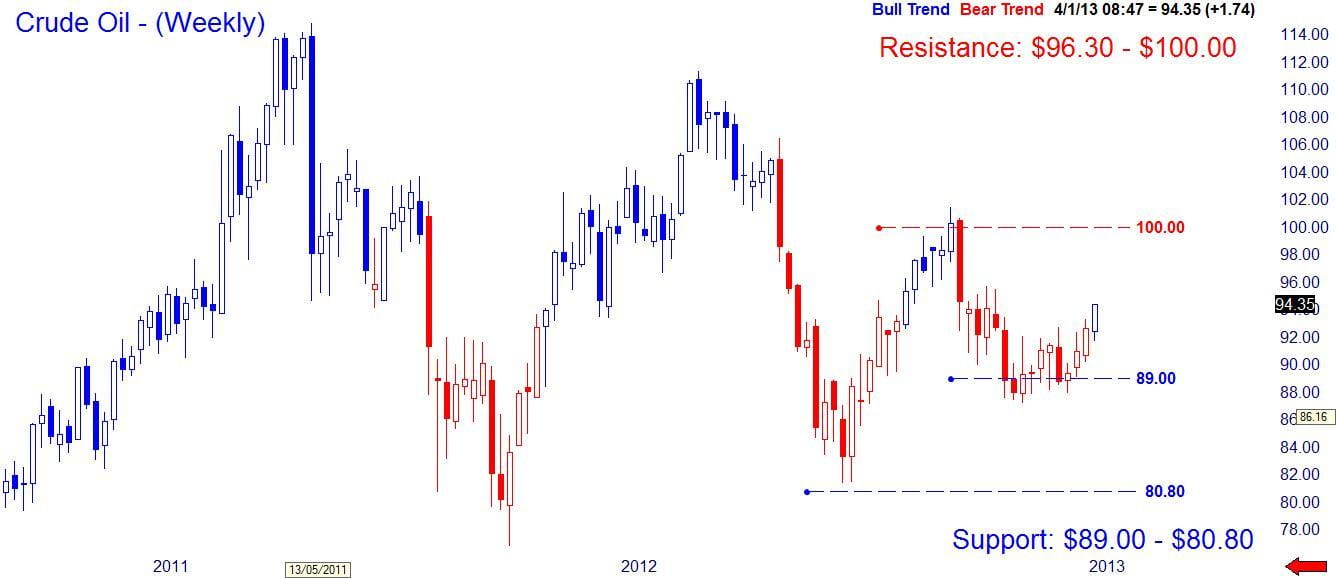
Crude oil eases back but still bullish
Crude oil prices have dipped lower after seeing a strong start this week. What is important is that the recent push higher has seen a potential trend reversal from being bearish to now turning bullish. For a further confirmation the commodity will need to break above this week’s high of $95.38 to prove that oil can continue towards the $100 level. Failing to hold above this week’s low of $91.77 may create concern for the bulls as the probability will shift to seeing the $89.00 support level being retested again. The chart patterns suggest that this level should provide a strong support level which, if broken, could see oil fall to $80.00.